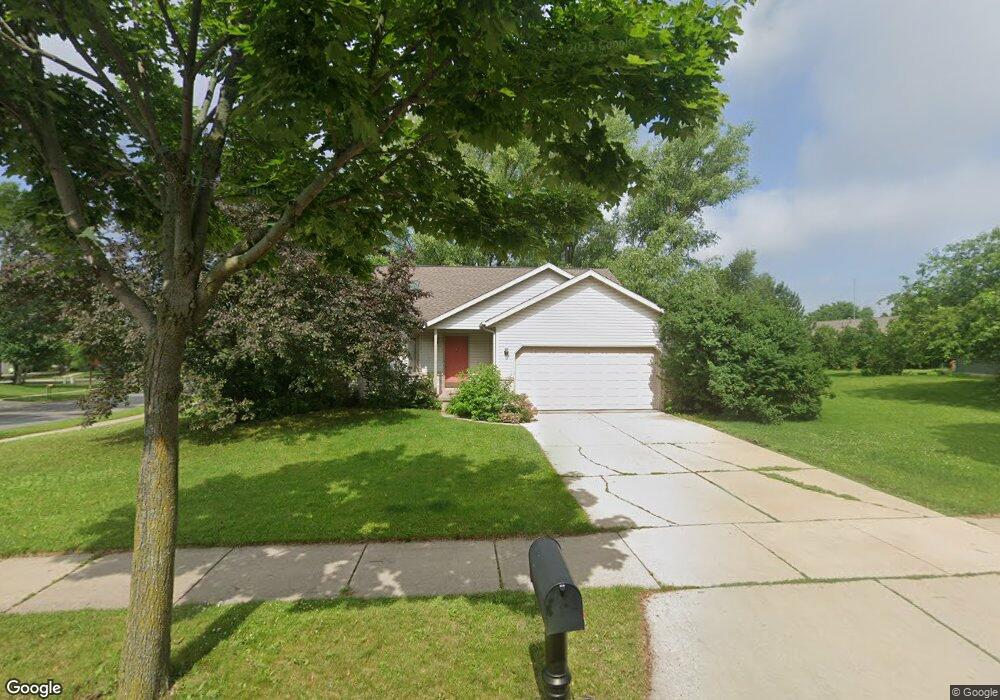
802 Twin Pines Dr Madison, WI 53704
Ridgewood NeighborhoodEstimated Value: $402,481 - $441,000
3
Beds
2
Baths
1,678
Sq Ft
$250/Sq Ft
Est. Value
About This Home
This home is located at 802 Twin Pines Dr, Madison, WI 53704 and is currently estimated at $420,120, approximately $250 per square foot. 802 Twin Pines Dr is a home located in Dane County with nearby schools including Schenk Elementary School, Whitehorse Middle School, and La Follette High School.
Ownership History
Date
Name
Owned For
Owner Type
Purchase Details
Closed on
Jul 6, 2016
Sold by
Brown Katherine Marie
Bought by
Brown David Allen
Current Estimated Value
Home Financials for this Owner
Home Financials are based on the most recent Mortgage that was taken out on this home.
Original Mortgage
$150,000
Outstanding Balance
$119,358
Interest Rate
3.48%
Mortgage Type
New Conventional
Estimated Equity
$300,762
Purchase Details
Closed on
May 6, 2015
Sold by
Brown David
Bought by
Brown Katherine M
Purchase Details
Closed on
Nov 21, 2008
Sold by
Brown David A
Bought by
Brown David A and Walters Brittany L
Purchase Details
Closed on
Mar 23, 2007
Sold by
Dresen Anthony M and Dresen Cheryl C
Bought by
Brown David A
Home Financials for this Owner
Home Financials are based on the most recent Mortgage that was taken out on this home.
Original Mortgage
$192,150
Interest Rate
9.12%
Mortgage Type
Purchase Money Mortgage
Create a Home Valuation Report for This Property
The Home Valuation Report is an in-depth analysis detailing your home's value as well as a comparison with similar homes in the area
Home Values in the Area
Average Home Value in this Area
Purchase History
| Date | Buyer | Sale Price | Title Company |
|---|---|---|---|
| Brown David Allen | -- | None Available | |
| Brown Katherine M | -- | None Available | |
| Brown David A | -- | None Available | |
| Brown David A | $213,500 | None Available |
Source: Public Records
Mortgage History
| Date | Status | Borrower | Loan Amount |
|---|---|---|---|
| Open | Brown David Allen | $150,000 | |
| Closed | Brown David A | $192,150 |
Source: Public Records
Tax History Compared to Growth
Tax History
| Year | Tax Paid | Tax Assessment Tax Assessment Total Assessment is a certain percentage of the fair market value that is determined by local assessors to be the total taxable value of land and additions on the property. | Land | Improvement |
|---|---|---|---|---|
| 2024 | $12,137 | $358,500 | $94,200 | $264,300 |
| 2023 | $6,066 | $341,400 | $89,700 | $251,700 |
| 2021 | $5,320 | $262,800 | $77,400 | $185,400 |
| 2020 | $5,306 | $245,600 | $72,300 | $173,300 |
| 2019 | $4,941 | $229,500 | $67,600 | $161,900 |
| 2018 | $4,814 | $222,800 | $67,600 | $155,200 |
| 2017 | $4,640 | $208,200 | $63,200 | $145,000 |
| 2016 | $4,569 | $200,200 | $63,200 | $137,000 |
| 2015 | $4,502 | $186,900 | $57,100 | $129,800 |
| 2014 | $4,319 | $186,900 | $57,100 | $129,800 |
| 2013 | $4,403 | $186,900 | $57,100 | $129,800 |
Source: Public Records
Map
Nearby Homes
- 939 Rockefeller Ln
- 1010 N Thompson Dr
- 822 Pulley Dr
- 701 Holy Cross Way
- 717 Bewick Dr
- 1121 Artisan Dr
- 949 Tony Dr
- 5214 Esker Dr
- 102 Violet Cir
- 5 Daffodil Ln
- 4525 Easley Ln
- Lot 3 Bellevine Ct
- 5609 Glorious Dr
- 1013 Wisdom Dr
- 5621 Glorious Dr
- 5611 Divine St
- 5619 Divine St
- 5624 Divine St
- 5620 Divine St
- 5702 Divine St
- 737 Mesta Ln
- 806 Twin Pines Dr
- 801 Twin Pines Dr
- 810 Twin Pines Dr
- 809 Twin Pines Dr
- 5105 Prairie Rose Rd
- 5101 Prairie Rose Rd
- 5109 Prairie Rose Rd
- 814 Twin Pines Dr
- 817 Twin Pines Dr
- 5118 Prairie Rose Rd
- 5113 Prairie Rose Rd
- 5105 Hazelcrest Dr
- 5101 Hazelcrest Dr
- 818 Twin Pines Dr
- 5106 Bluestem Way
- 5122 Prairie Rose Rd
- 5117 Prairie Rose Rd
- 5109 Hazelcrest Dr
- 5102 Bluestem Way