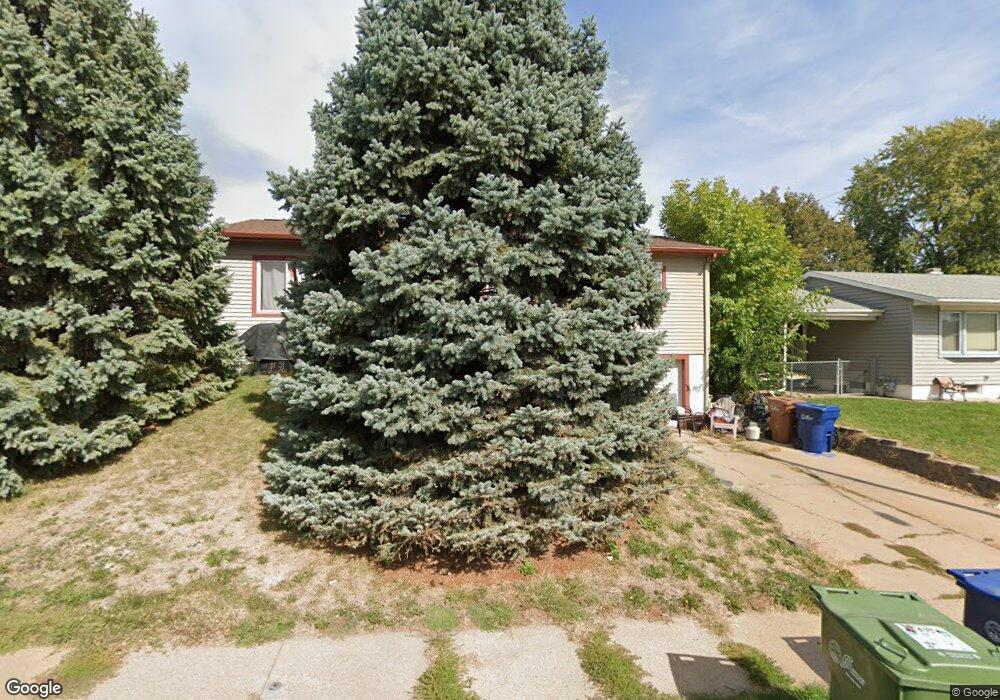
802 W 33rd Ave Bellevue, NE 68005
Estimated Value: $204,000 - $212,000
3
Beds
1
Bath
1,648
Sq Ft
$126/Sq Ft
Est. Value
About This Home
This home is located at 802 W 33rd Ave, Bellevue, NE 68005 and is currently estimated at $207,592, approximately $125 per square foot. 802 W 33rd Ave is a home located in Sarpy County with nearby schools including Betz Elementary School, Bellevue Mission Middle School, and Bellevue East High School.
Ownership History
Date
Name
Owned For
Owner Type
Purchase Details
Closed on
Apr 16, 2019
Sold by
Hayden Robert W and Hayden Denise A
Bought by
Caldarelli Jennifer L
Current Estimated Value
Home Financials for this Owner
Home Financials are based on the most recent Mortgage that was taken out on this home.
Original Mortgage
$143,060
Outstanding Balance
$125,519
Interest Rate
4.2%
Mortgage Type
FHA
Estimated Equity
$82,073
Purchase Details
Closed on
Jul 28, 2016
Sold by
Bowman Bartlett G and Bowman Sherry A
Bought by
Hayden Robert W and Hayden Denise A
Home Financials for this Owner
Home Financials are based on the most recent Mortgage that was taken out on this home.
Original Mortgage
$100,000
Interest Rate
3.41%
Purchase Details
Closed on
Apr 7, 2002
Sold by
Koziel Joseph A
Bought by
Bowman Bartlett G and Bowman Sherry A
Home Financials for this Owner
Home Financials are based on the most recent Mortgage that was taken out on this home.
Original Mortgage
$87,250
Interest Rate
6.83%
Create a Home Valuation Report for This Property
The Home Valuation Report is an in-depth analysis detailing your home's value as well as a comparison with similar homes in the area
Home Values in the Area
Average Home Value in this Area
Purchase History
| Date | Buyer | Sale Price | Title Company |
|---|---|---|---|
| Caldarelli Jennifer L | $148,000 | Dri Title & Escrow | |
| Hayden Robert W | $113,000 | Titlecore National Llc | |
| Bowman Bartlett G | $90,000 | Suburban Title & Escrow |
Source: Public Records
Mortgage History
| Date | Status | Borrower | Loan Amount |
|---|---|---|---|
| Open | Caldarelli Jennifer L | $143,060 | |
| Previous Owner | Hayden Robert W | $100,000 | |
| Previous Owner | Bowman Bartlett G | $87,250 |
Source: Public Records
Tax History
| Year | Tax Paid | Tax Assessment Tax Assessment Total Assessment is a certain percentage of the fair market value that is determined by local assessors to be the total taxable value of land and additions on the property. | Land | Improvement |
|---|---|---|---|---|
| 2025 | $2,894 | $177,549 | $30,000 | $147,549 |
| 2024 | $3,178 | $165,650 | $25,000 | $140,650 |
| 2023 | $3,178 | $150,512 | $25,000 | $125,512 |
| 2022 | $2,915 | $135,454 | $20,000 | $115,454 |
| 2021 | $2,483 | $114,129 | $18,000 | $96,129 |
| 2020 | $2,310 | $105,840 | $18,000 | $87,840 |
| 2019 | $2,239 | $103,255 | $18,000 | $85,255 |
| 2018 | $2,138 | $101,224 | $18,000 | $83,224 |
| 2017 | $2,023 | $95,145 | $18,000 | $77,145 |
| 2016 | $1,855 | $89,186 | $18,000 | $71,186 |
| 2015 | $1,800 | $87,031 | $18,000 | $69,031 |
| 2014 | $1,864 | $89,553 | $18,000 | $71,553 |
| 2012 | -- | $93,216 | $18,000 | $75,216 |
Source: Public Records
Map
Nearby Homes
- 1004 W 31st Ave
- 1014 W 31st Ave
- 409 W 30th Ave
- 3101 Washington St Unit 15
- 3101 Washington St Unit Lot 18
- 3101 Washington St Unit 53
- 3101 Washington St Unit 73
- 3101 Washington St Unit lot 69
- 2707 Calhoun St
- 404 W 30th Ave
- 2802 Wayne St
- 2902 Hancock St
- 2411 Madison St
- 2504 Washington St
- 2503 Washington St
- 2303 Madison St
- 2405 Hancock St
- 411 W 22nd Ave
- 2309 Main St
- 2010 Jackson St
Your Personal Tour Guide
Ask me questions while you tour the home.