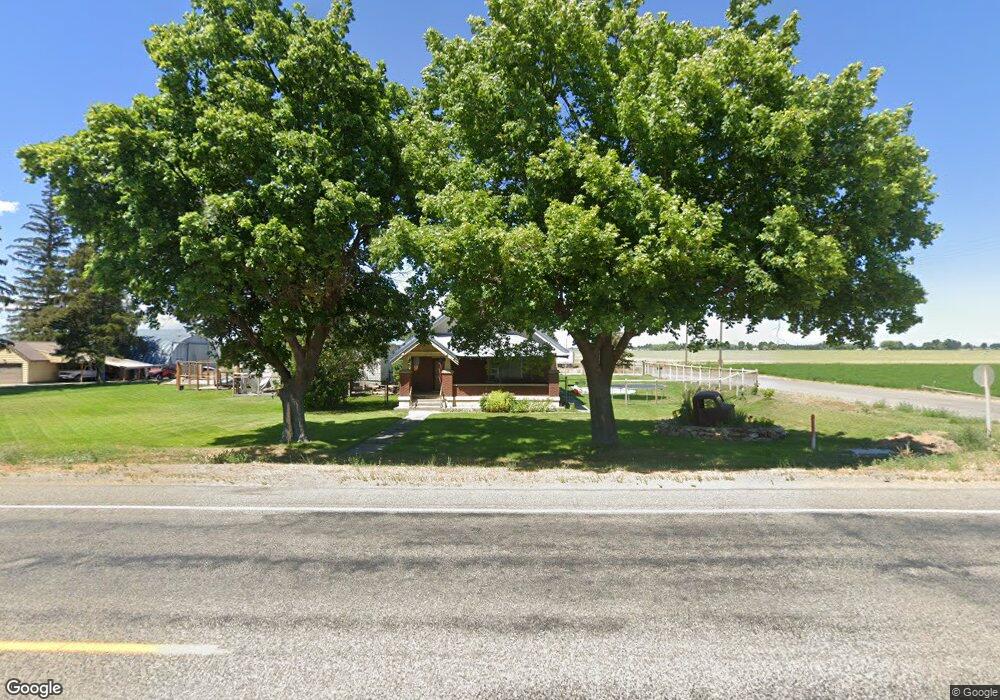
802 W Highway 39 Blackfoot, ID 83221
Estimated Value: $350,471 - $371,000
3
Beds
2
Baths
1,433
Sq Ft
$253/Sq Ft
Est. Value
About This Home
This home is located at 802 W Highway 39, Blackfoot, ID 83221 and is currently estimated at $362,118, approximately $252 per square foot. 802 W Highway 39 is a home with nearby schools including Riverside Elementary School, Moreland Elementary School, and Rockford Elementary School.
Ownership History
Date
Name
Owned For
Owner Type
Purchase Details
Closed on
May 13, 2005
Sold by
Taylor Owen Jed and Taylor Debra
Bought by
Wixom Wes and Wixom Ashlee
Current Estimated Value
Home Financials for this Owner
Home Financials are based on the most recent Mortgage that was taken out on this home.
Original Mortgage
$21,600
Interest Rate
6.02%
Mortgage Type
Credit Line Revolving
Purchase Details
Closed on
May 12, 2005
Sold by
Taylor Wade and Taylor Fran
Bought by
Wixom Wes and Wixom Ashlee
Home Financials for this Owner
Home Financials are based on the most recent Mortgage that was taken out on this home.
Original Mortgage
$21,600
Interest Rate
6.02%
Mortgage Type
Credit Line Revolving
Create a Home Valuation Report for This Property
The Home Valuation Report is an in-depth analysis detailing your home's value as well as a comparison with similar homes in the area
Home Values in the Area
Average Home Value in this Area
Purchase History
| Date | Buyer | Sale Price | Title Company |
|---|---|---|---|
| Wixom Wes | -- | First American Title Company | |
| Wixom Wes | -- | First American Title Company |
Source: Public Records
Mortgage History
| Date | Status | Borrower | Loan Amount |
|---|---|---|---|
| Closed | Wixom Wes | $21,600 | |
| Open | Wixom Wes | $86,400 |
Source: Public Records
Tax History Compared to Growth
Tax History
| Year | Tax Paid | Tax Assessment Tax Assessment Total Assessment is a certain percentage of the fair market value that is determined by local assessors to be the total taxable value of land and additions on the property. | Land | Improvement |
|---|---|---|---|---|
| 2025 | $1,138 | $351,514 | $70,000 | $281,514 |
| 2024 | $1,138 | $336,514 | $55,000 | $281,514 |
| 2023 | $1,079 | $336,514 | $55,000 | $281,514 |
| 2022 | $1,931 | $262,468 | $55,000 | $207,468 |
| 2021 | $1,420 | $228,365 | $47,000 | $181,365 |
| 2020 | $2,393 | $183,281 | $0 | $0 |
| 2019 | $2,625 | $183,281 | $0 | $0 |
| 2018 | $2,352 | $151,795 | $32,000 | $119,795 |
| 2017 | $2,301 | $144,795 | $25,000 | $119,795 |
| 2016 | $2,288 | $144,795 | $0 | $0 |
| 2015 | $2,061 | $144,795 | $0 | $0 |
| 2014 | $2,061 | $144,795 | $25,000 | $119,795 |
Source: Public Records
Map
Nearby Homes