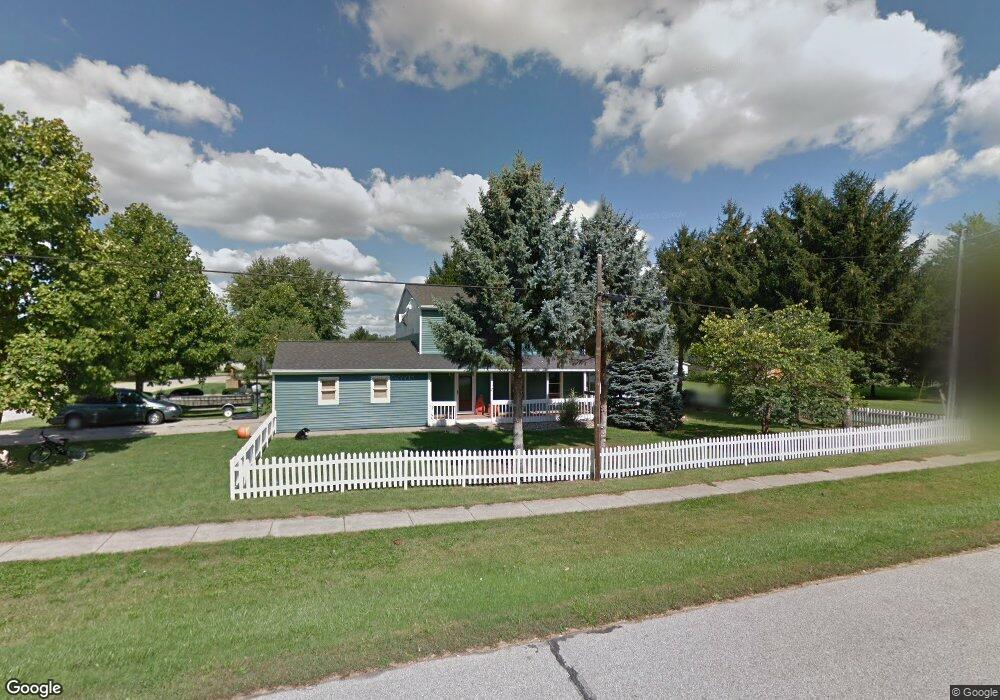
802 W Toledo St Fremont, IN 46737
Estimated Value: $231,000 - $273,000
3
Beds
1
Bath
1,680
Sq Ft
$150/Sq Ft
Est. Value
About This Home
This home is located at 802 W Toledo St, Fremont, IN 46737 and is currently estimated at $252,840, approximately $150 per square foot. 802 W Toledo St is a home located in Steuben County with nearby schools including Fremont Elementary School, Fremont Middle School, and Fremont High School.
Ownership History
Date
Name
Owned For
Owner Type
Purchase Details
Closed on
Aug 24, 2007
Sold by
Hud
Bought by
Verdin Brent and Verdin Corey
Current Estimated Value
Home Financials for this Owner
Home Financials are based on the most recent Mortgage that was taken out on this home.
Original Mortgage
$94,760
Outstanding Balance
$60,181
Interest Rate
6.72%
Mortgage Type
New Conventional
Estimated Equity
$192,659
Purchase Details
Closed on
Aug 21, 2007
Sold by
Jackson Alphonso
Bought by
Verdin Brent and Verdin Corey
Home Financials for this Owner
Home Financials are based on the most recent Mortgage that was taken out on this home.
Original Mortgage
$94,760
Outstanding Balance
$60,181
Interest Rate
6.72%
Mortgage Type
New Conventional
Estimated Equity
$192,659
Purchase Details
Closed on
Sep 28, 2006
Sold by
Abn Amro Mortgage Group Inc
Bought by
The Sec Of Housing & Urban
Purchase Details
Closed on
Jun 22, 1998
Sold by
Helfrich Richard L and Helfrich Joanne
Bought by
Hetherington Laura A
Create a Home Valuation Report for This Property
The Home Valuation Report is an in-depth analysis detailing your home's value as well as a comparison with similar homes in the area
Home Values in the Area
Average Home Value in this Area
Purchase History
| Date | Buyer | Sale Price | Title Company |
|---|---|---|---|
| Verdin Brent | $94,760 | Village Title Inc | |
| Verdin Brent | -- | None Available | |
| The Sec Of Housing & Urban | -- | -- | |
| Hetherington Laura A | $115,000 | -- |
Source: Public Records
Mortgage History
| Date | Status | Borrower | Loan Amount |
|---|---|---|---|
| Open | Verdin Brent | $94,760 |
Source: Public Records
Tax History Compared to Growth
Tax History
| Year | Tax Paid | Tax Assessment Tax Assessment Total Assessment is a certain percentage of the fair market value that is determined by local assessors to be the total taxable value of land and additions on the property. | Land | Improvement |
|---|---|---|---|---|
| 2024 | $1,517 | $223,700 | $21,000 | $202,700 |
| 2023 | $1,428 | $215,600 | $20,000 | $195,600 |
| 2022 | $1,305 | $183,800 | $18,200 | $165,600 |
| 2021 | $1,165 | $164,700 | $17,700 | $147,000 |
| 2020 | $1,107 | $157,000 | $16,900 | $140,100 |
| 2019 | $934 | $140,000 | $16,900 | $123,100 |
| 2018 | $938 | $136,000 | $16,900 | $119,100 |
| 2017 | $858 | $128,300 | $16,900 | $111,400 |
| 2016 | $739 | $121,200 | $16,900 | $104,300 |
| 2014 | $537 | $111,200 | $17,000 | $94,200 |
| 2013 | $537 | $112,200 | $17,000 | $95,200 |
Source: Public Records
Map
Nearby Homes
- 50 Janedale Dr
- 1000 W Toledo St
- 00 W Toledo St
- 913 W Cora Ln
- 603 W Follett Ln
- 1001 Nicholas Trail
- 1000 Nicholas Trail
- 200 Michael St
- TBD Indiana 120
- 506 S Broad St
- 00 N 300 Rd E
- 6405 N 300 E
- 202 E Toledo St
- 105 N Mill St
- TBD Evans Dr
- 304 Hardy St
- 815 Cherry Hill Ct
- 406 Prairie Ln
- 115 355 Ln
- 3217 E 700 N
- 102 Abbott Dr
- 104 Abbott Dr
- 800 W Toledo St
- 103 Abbott Dr
- 803 W Toledo St
- 000 Lot 13 Abbott Estates
- Lot 13 Abbott Estates
- 805 W Toledo St
- 801 W Toledo St
- 105 Abbott Dr
- 10 Pamela Place
- 807 W Toledo St
- 20 Pamela Place
- 107 Abbott Dr
- 808 W Toledo St
- 708 W Toledo St
- 802 W Renee Dr
- 804 W Renee Dr
- 800 W Renee Dr
- 809 W Toledo St