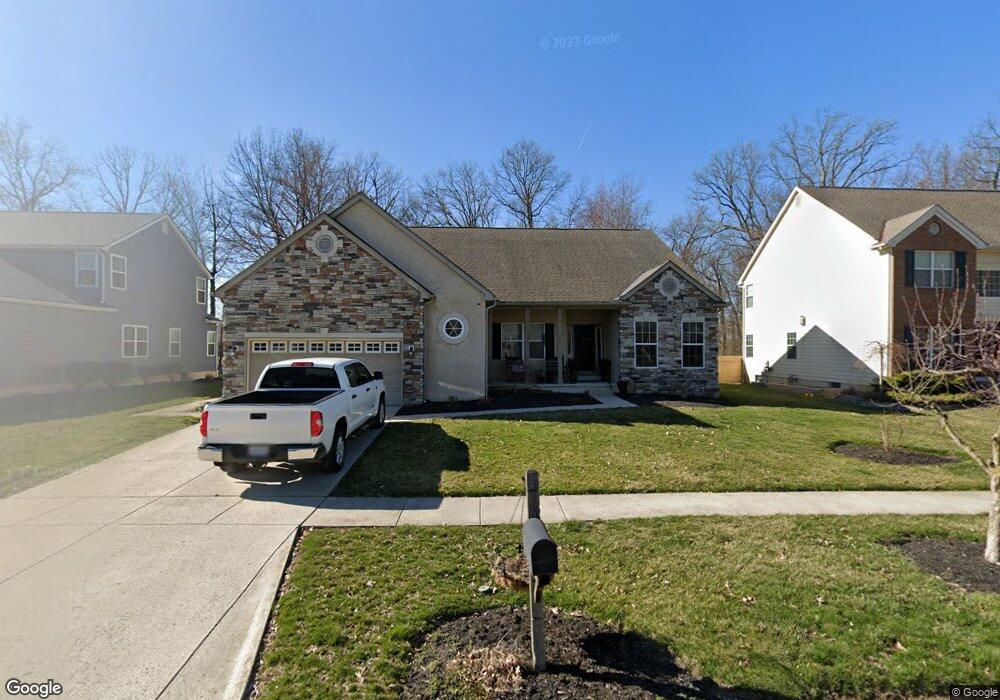
802 Wedgewood Dr Marysville, OH 43040
Estimated Value: $474,000 - $496,000
3
Beds
3
Baths
2,560
Sq Ft
$189/Sq Ft
Est. Value
About This Home
This home is located at 802 Wedgewood Dr, Marysville, OH 43040 and is currently estimated at $483,477, approximately $188 per square foot. 802 Wedgewood Dr is a home located in Union County with nearby schools including Edgewood Elementary School, Creekview Intermediate Elementary School, and Bunsold Middle School.
Ownership History
Date
Name
Owned For
Owner Type
Purchase Details
Closed on
Aug 31, 2023
Sold by
Shanks Charley A
Bought by
Shanks Charley A and Shanks Kathleen F
Current Estimated Value
Purchase Details
Closed on
Sep 26, 2003
Sold by
W D Custom Trim Llc
Bought by
Shanks Charley A
Home Financials for this Owner
Home Financials are based on the most recent Mortgage that was taken out on this home.
Original Mortgage
$232,000
Interest Rate
5%
Mortgage Type
Purchase Money Mortgage
Purchase Details
Closed on
Apr 14, 2003
Sold by
Timber View Development Co
Bought by
Wd Custom Trim Llc
Home Financials for this Owner
Home Financials are based on the most recent Mortgage that was taken out on this home.
Original Mortgage
$231,100
Interest Rate
5.75%
Mortgage Type
Construction
Create a Home Valuation Report for This Property
The Home Valuation Report is an in-depth analysis detailing your home's value as well as a comparison with similar homes in the area
Home Values in the Area
Average Home Value in this Area
Purchase History
| Date | Buyer | Sale Price | Title Company |
|---|---|---|---|
| Shanks Charley A | -- | None Listed On Document | |
| Shanks Charley A | $290,400 | -- | |
| Wd Custom Trim Llc | $40,000 | -- |
Source: Public Records
Mortgage History
| Date | Status | Borrower | Loan Amount |
|---|---|---|---|
| Previous Owner | Shanks Charley A | $232,000 | |
| Previous Owner | Shanks Charley A | $232,000 | |
| Previous Owner | Wd Custom Trim Llc | $231,100 | |
| Closed | Shanks Charley A | $43,500 |
Source: Public Records
Tax History Compared to Growth
Tax History
| Year | Tax Paid | Tax Assessment Tax Assessment Total Assessment is a certain percentage of the fair market value that is determined by local assessors to be the total taxable value of land and additions on the property. | Land | Improvement |
|---|---|---|---|---|
| 2024 | $5,952 | $142,640 | $17,190 | $125,450 |
| 2023 | $5,952 | $142,640 | $17,190 | $125,450 |
| 2022 | $5,843 | $142,640 | $17,190 | $125,450 |
| 2021 | $5,713 | $121,900 | $13,240 | $108,660 |
| 2020 | $5,704 | $121,900 | $13,240 | $108,660 |
| 2019 | $5,773 | $121,900 | $13,240 | $108,660 |
| 2018 | $4,435 | $87,200 | $10,300 | $76,900 |
| 2017 | $4,336 | $87,200 | $10,300 | $76,900 |
| 2016 | $4,269 | $86,140 | $10,300 | $75,840 |
| 2015 | $3,789 | $71,500 | $10,300 | $61,200 |
| 2014 | $3,789 | $71,500 | $10,300 | $61,200 |
| 2013 | $3,567 | $71,500 | $10,300 | $61,200 |
Source: Public Records
Map
Nearby Homes
- 876 Hickory Hill Dr
- 801 Timbers Edge
- 840 Autumn Chase Ln
- 820 Timbers Edge
- 1220 Ashford Dr
- 675 Bermuda Way
- 780 Bermuda Way
- 426 Timberview Dr
- 115 Black Oak Ave
- Birmingham Plan at Darby Run
- Longwood Plan at Darby Run
- Rockford Plan at Darby Run
- Chattanooga Plan at Darby Run
- Carlisle Plan at Darby Run
- Miramar Plan at Darby Run
- Somerset Plan at Darby Run
- Sanibel Plan at Darby Run
- 18261 Boerger Rd
- 1191 Woodline Dr
- 409 Prairie Dr
- 806 Wedgewood Dr
- 788 Wedgewood Ct
- 788 Wedgewood Dr
- 2050 Wedgewood Dr
- 2051 Wedgewood Dr
- 0 Wedgewood Dr Unit 2050 2318740
- 0 Wedgewood Dr Unit 2051 2318744
- 81 Wedgewood Dr
- 710 Wedgewood Dr
- 54 Wedgewood Dr Unit 2301
- 2031 Wedgewood Dr
- 0 Wedgewood Dr Unit 9815698
- 0 Wedgewood Dr Unit L 67 9707507
- 0 Wedgewood Dr Unit L-40
- 0 Wedgewood Dr Unit L-39
- 2027 Wedgewood Dr
- 810 Wedgewood Dr
- 782 Wedgewood Ct
- 655 Timberview Dr
- 776 Wedgewood Dr