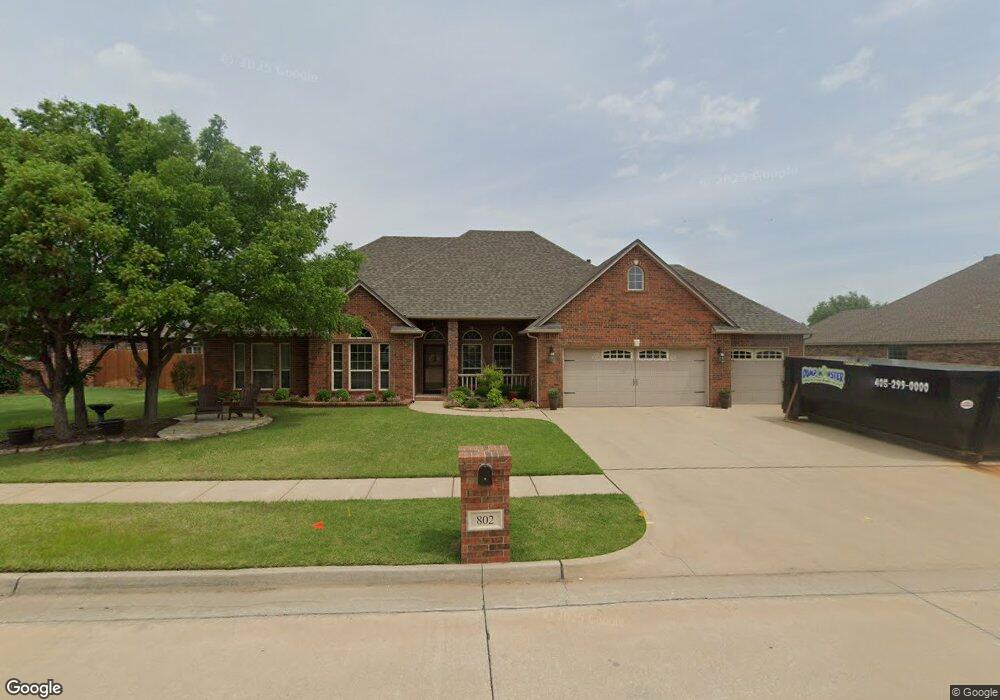
802 Windsor Place El Reno, OK 73036
Estimated Value: $182,000
3
Beds
2
Baths
1,677
Sq Ft
$109/Sq Ft
Est. Value
About This Home
This home is located at 802 Windsor Place, El Reno, OK 73036 and is currently estimated at $182,000, approximately $108 per square foot. 802 Windsor Place is a home located in Canadian County with nearby schools including Hillcrest Elementary School, Lincoln Learning Center, and Rose Witcher Elementary School.
Ownership History
Date
Name
Owned For
Owner Type
Purchase Details
Closed on
Jul 27, 2021
Sold by
Wakefield and Bradley
Bought by
Zuroff Troy L
Current Estimated Value
Home Financials for this Owner
Home Financials are based on the most recent Mortgage that was taken out on this home.
Original Mortgage
$216,015
Interest Rate
2.96%
Mortgage Type
FHA
Purchase Details
Closed on
May 28, 2021
Sold by
Wakefield and Bradley
Bought by
Zuroff Troy L
Home Financials for this Owner
Home Financials are based on the most recent Mortgage that was taken out on this home.
Original Mortgage
$216,015
Interest Rate
2.96%
Mortgage Type
FHA
Purchase Details
Closed on
Dec 12, 2011
Sold by
Brooks Helen V
Bought by
Wakefield Matthew Clay
Home Financials for this Owner
Home Financials are based on the most recent Mortgage that was taken out on this home.
Original Mortgage
$45,000
Interest Rate
4.14%
Purchase Details
Closed on
Aug 21, 1998
Sold by
Brooks Helen
Purchase Details
Closed on
Mar 1, 1987
Create a Home Valuation Report for This Property
The Home Valuation Report is an in-depth analysis detailing your home's value as well as a comparison with similar homes in the area
Home Values in the Area
Average Home Value in this Area
Purchase History
| Date | Buyer | Sale Price | Title Company |
|---|---|---|---|
| Zuroff Troy L | $220,000 | Chicago Title | |
| Zuroff Troy L | $220,000 | Chicago Title | |
| Wakefield Matthew Clay | $45,000 | None Available | |
| -- | -- | -- | |
| -- | -- | -- |
Source: Public Records
Mortgage History
| Date | Status | Borrower | Loan Amount |
|---|---|---|---|
| Previous Owner | Zuroff Troy L | $216,015 | |
| Previous Owner | Zuroff Troy L | $216,015 | |
| Previous Owner | Wakefield Matthew Clay | $45,000 |
Source: Public Records
Tax History Compared to Growth
Tax History
| Year | Tax Paid | Tax Assessment Tax Assessment Total Assessment is a certain percentage of the fair market value that is determined by local assessors to be the total taxable value of land and additions on the property. | Land | Improvement |
|---|---|---|---|---|
| 2024 | $112 | $1,516 | $1,240 | $276 |
| 2023 | $112 | $1,516 | $1,240 | $276 |
| 2022 | $1,247 | $16,831 | $525 | $16,306 |
| 2021 | $958 | $12,926 | $1,765 | $11,161 |
| 2020 | $931 | $12,550 | $1,765 | $10,785 |
| 2019 | $904 | $12,184 | $1,765 | $10,419 |
| 2018 | $879 | $11,830 | $1,767 | $10,063 |
| 2017 | $854 | $11,486 | $1,767 | $9,719 |
| 2016 | $830 | $11,485 | $1,767 | $9,718 |
| 2015 | -- | $10,826 | $2,387 | $8,439 |
| 2014 | -- | $10,511 | $2,387 | $8,124 |
Source: Public Records
Map
Nearby Homes
- 1309 Fairfax Ln
- 800 Fairfax Ln
- 1502 S Reno Ave
- 605 Thompson Dr
- 601 Thompson Dr
- 1515 Strawberry Fields
- 1127 S Reno Ave
- 1517 Strawberry
- 1519 Strawberry Fields
- 1523 Strawberry Fields
- 1220 Strawberry Fields
- 1260 Penny Ln
- 508 SW 24th St
- 1705 S Dille Ave
- 1012 S Ellison Ave
- 2502 Ridgecrest Dr
- 420 SW 24th St
- 300 Cherokee Ln
- 818 SW 26th Place
- 2606 Ridgecrest Dr
- 802 Windsor Place
- 804 Windsor Place
- 800 Windsor Place
- 822 Windsor Place
- 803 Windsor Place
- 807 Windsor Place
- 820 Windsor Place
- 805 Windsor Place
- 801 Windsor Place
- 824 Windsor Place
- 819 Windsor Place
- 1307 Fairfax Ln
- 811 Windsor Place
- 1305 Fairfax Ln
- 1303 Fairfax Ln
- 800 Hampton Ct
- 1311 Fairfax Ln
- 821 Windsor Place
- 804 Hampton Ct
- 804 Hampton Ct