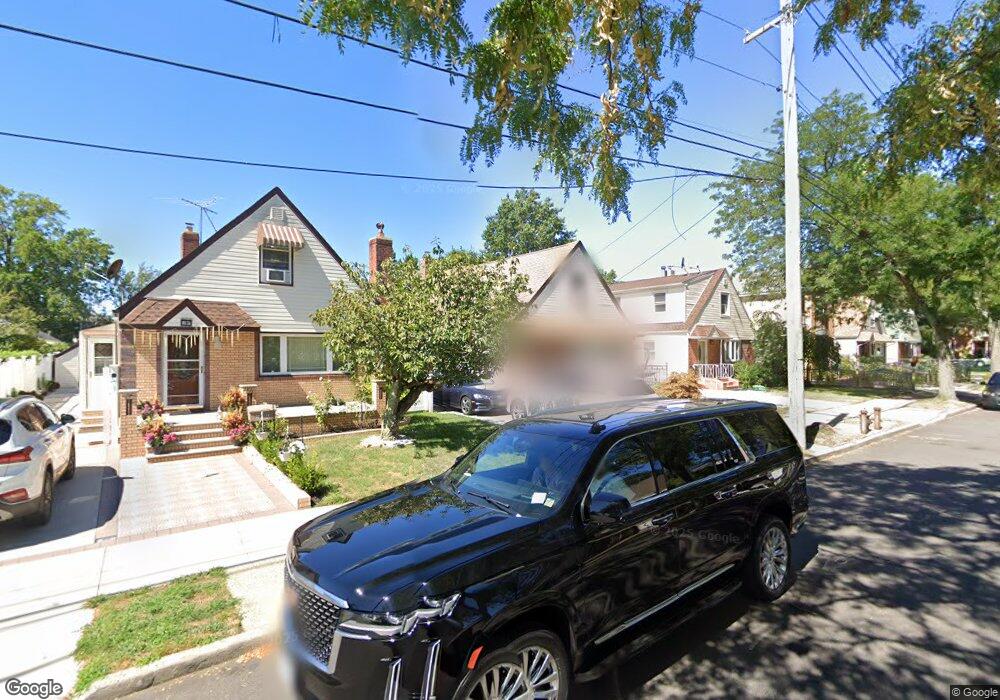
8020 268th St Glen Oaks, NY 11004
Estimated Value: $871,997 - $939,000
--
Bed
--
Bath
1,500
Sq Ft
$599/Sq Ft
Est. Value
About This Home
This home is located at 8020 268th St, Glen Oaks, NY 11004 and is currently estimated at $898,249, approximately $598 per square foot. 8020 268th St is a home located in Queens County with nearby schools including P.S.115Q James J Ambrose School, Fremont/Hay Elementary School, and Irwin Altman Middle School 172.
Ownership History
Date
Name
Owned For
Owner Type
Purchase Details
Closed on
Feb 19, 2022
Sold by
Khela Harinder S and Khela Pargat Singh
Bought by
Khela Harinder S
Current Estimated Value
Home Financials for this Owner
Home Financials are based on the most recent Mortgage that was taken out on this home.
Original Mortgage
$400,482
Outstanding Balance
$371,110
Interest Rate
3.69%
Mortgage Type
Purchase Money Mortgage
Estimated Equity
$527,139
Purchase Details
Closed on
Dec 8, 2008
Sold by
Sharon Schager Trustee and Shiela A Hajari Trustee
Bought by
Khela Harinder S and Khela Pargat Singh
Home Financials for this Owner
Home Financials are based on the most recent Mortgage that was taken out on this home.
Original Mortgage
$384,000
Interest Rate
6.27%
Mortgage Type
Purchase Money Mortgage
Purchase Details
Closed on
Dec 3, 2003
Sold by
Keiser Mary and Keiser William Thomas
Bought by
Keiser William Thomas
Create a Home Valuation Report for This Property
The Home Valuation Report is an in-depth analysis detailing your home's value as well as a comparison with similar homes in the area
Home Values in the Area
Average Home Value in this Area
Purchase History
| Date | Buyer | Sale Price | Title Company |
|---|---|---|---|
| Khela Harinder S | -- | -- | |
| Khela Harinder S | -- | -- | |
| Khela Harinder S | -- | -- | |
| Khela Harinder S | $480,000 | -- | |
| Khela Harinder S | $480,000 | -- | |
| Keiser William Thomas | -- | -- | |
| Keiser William Thomas | -- | -- |
Source: Public Records
Mortgage History
| Date | Status | Borrower | Loan Amount |
|---|---|---|---|
| Open | Khela Harinder S | $400,482 | |
| Closed | Khela Harinder S | $400,482 | |
| Closed | Khela Harinder S | $384,000 |
Source: Public Records
Tax History Compared to Growth
Tax History
| Year | Tax Paid | Tax Assessment Tax Assessment Total Assessment is a certain percentage of the fair market value that is determined by local assessors to be the total taxable value of land and additions on the property. | Land | Improvement |
|---|---|---|---|---|
| 2025 | $7,528 | $41,213 | $14,685 | $26,528 |
| 2024 | $7,809 | $38,880 | $14,033 | $24,847 |
| 2023 | $7,528 | $38,880 | $13,559 | $25,321 |
| 2022 | $7,355 | $44,940 | $16,740 | $28,200 |
| 2021 | $7,304 | $42,420 | $16,740 | $25,680 |
| 2020 | $6,974 | $39,000 | $16,740 | $22,260 |
| 2019 | $6,485 | $42,180 | $16,740 | $25,440 |
| 2018 | $6,307 | $32,400 | $11,679 | $20,721 |
| 2017 | $6,203 | $31,900 | $15,240 | $16,660 |
| 2016 | $5,707 | $31,900 | $15,240 | $16,660 |
| 2015 | $3,410 | $28,620 | $18,445 | $10,175 |
| 2014 | $3,410 | $27,000 | $18,600 | $8,400 |
Source: Public Records
Map
Nearby Homes
- 80-59 268th St
- 80-64 266th St
- 79-12 268th St
- 8168 Langdale St Unit 263A
- 81-25 265th St
- 81-49 268th St Unit 290B
- 81-51 Langdale St Unit 207A
- 268-03 82nd Ave Unit 286A
- 78-37 267th St
- 78-30 270th St
- 7836 271st St
- 78-36 271st St
- 82-25 268th St Unit 175B
- 8224 Langdale St Unit 138B
- 81-56 264th St
- 1683 Stewart Ave
- 78-07 264th St
- 8143 262nd St
- 82-65 268th St Unit 2nd Floor
- 80-18 261st St