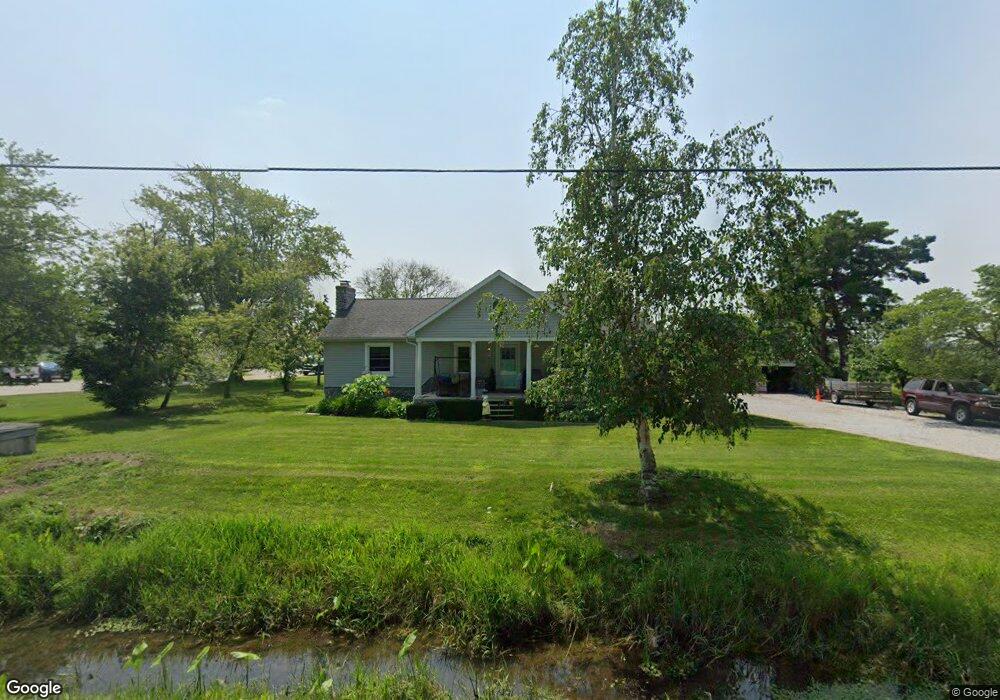
8020 Cedar Point Rd Oregon, OH 43616
Estimated Value: $216,000 - $262,000
2
Beds
2
Baths
1,800
Sq Ft
$131/Sq Ft
Est. Value
About This Home
This home is located at 8020 Cedar Point Rd, Oregon, OH 43616 and is currently estimated at $236,078, approximately $131 per square foot. 8020 Cedar Point Rd is a home located in Lucas County.
Ownership History
Date
Name
Owned For
Owner Type
Purchase Details
Closed on
Oct 25, 2013
Sold by
Basden Robert and Basden Cynthia L
Bought by
Basden Robert and Basden Cynthia L
Current Estimated Value
Home Financials for this Owner
Home Financials are based on the most recent Mortgage that was taken out on this home.
Original Mortgage
$92,327
Outstanding Balance
$68,751
Interest Rate
4.5%
Mortgage Type
Future Advance Clause Open End Mortgage
Estimated Equity
$167,327
Purchase Details
Closed on
Aug 25, 2006
Sold by
Reynolds Pamela S
Bought by
Basden Robert and Berlincourt Cynthia L
Home Financials for this Owner
Home Financials are based on the most recent Mortgage that was taken out on this home.
Original Mortgage
$46,350
Interest Rate
6.77%
Mortgage Type
Purchase Money Mortgage
Purchase Details
Closed on
Mar 11, 1999
Sold by
Sharon Marjorie J
Bought by
Sharon Marjorie J and Sharon Sandra K
Purchase Details
Closed on
Mar 9, 1989
Sold by
Sharon J J and M J
Create a Home Valuation Report for This Property
The Home Valuation Report is an in-depth analysis detailing your home's value as well as a comparison with similar homes in the area
Purchase History
| Date | Buyer | Sale Price | Title Company |
|---|---|---|---|
| Basden Robert | -- | Service Link | |
| Basden Robert | $46,400 | Chicago Title Insurance Co | |
| Sharon Marjorie J | -- | -- | |
| -- | -- | -- |
Source: Public Records
Mortgage History
| Date | Status | Borrower | Loan Amount |
|---|---|---|---|
| Open | Basden Robert | $92,327 | |
| Closed | Basden Robert | $46,350 |
Source: Public Records
Tax History
| Year | Tax Paid | Tax Assessment Tax Assessment Total Assessment is a certain percentage of the fair market value that is determined by local assessors to be the total taxable value of land and additions on the property. | Land | Improvement |
|---|---|---|---|---|
| 2025 | -- | $59,115 | $7,630 | $51,485 |
| 2024 | $1,632 | $59,115 | $7,630 | $51,485 |
| 2023 | $3,387 | $51,275 | $3,290 | $47,985 |
| 2022 | $3,377 | $51,275 | $3,290 | $47,985 |
| 2021 | $3,395 | $51,275 | $3,290 | $47,985 |
| 2020 | $3,249 | $41,860 | $2,730 | $39,130 |
| 2019 | $3,109 | $41,860 | $2,730 | $39,130 |
| 2018 | $3,024 | $41,860 | $2,730 | $39,130 |
| 2017 | $2,997 | $37,975 | $1,365 | $36,610 |
| 2016 | $2,965 | $108,500 | $3,900 | $104,600 |
| 2015 | $2,949 | $108,500 | $3,900 | $104,600 |
| 2014 | $2,525 | $37,980 | $1,370 | $36,610 |
| 2013 | $2,525 | $37,980 | $1,370 | $36,610 |
Source: Public Records
Map
Nearby Homes
- 8246 Cedar Point Rd
- 1031 N Cousino Rd
- 9015 Seaman Rd
- 7330 Jerusalem Rd
- 6028 Bayshore Rd
- 1944 Ashcroft Dr
- 5914 Kacy Ln
- 5882 Kacy Ln
- 1561 N Stadium Rd
- 455 Cody
- 454 Cody Dr
- 5560 Eagles Landing Dr
- 5524 Eagles Landing Dr
- 5281 Eagles Landing Dr
- 5313 Eagles Landing Dr
- 5548 Eagles Landing Dr
- 5514 Eagles Landing Dr
- 5415 Seaman Rd
- 1536 N Wynn Rd
- 2046 Duchesse Dr
- 8056 Cedar Point Rd
- 8013 Cedar Point Rd
- 7951 Cedar Point Rd
- 8110 Cedar Point Rd
- 7947 Cedar Point Rd
- 1039 N Cousino Rd
- 1055 N Cousino Rd
- 1105 N Cousino Rd
- 1121 N Cousino Rd
- 8128 Cedar Point Rd
- 8131 Cedar Point Rd
- 7910 Cedar Point Rd
- 8205 Cedar Point Rd
- 8219 Cedar Point Rd
- 1100 N Cousino Rd
- 8223 Cedar Point Rd
- 8230 Cedar Point Rd
- 7832 Cedar Point Rd
- 1007 N Cousino Rd
- 1040 N Cousino Rd
Your Personal Tour Guide
Ask me questions while you tour the home.