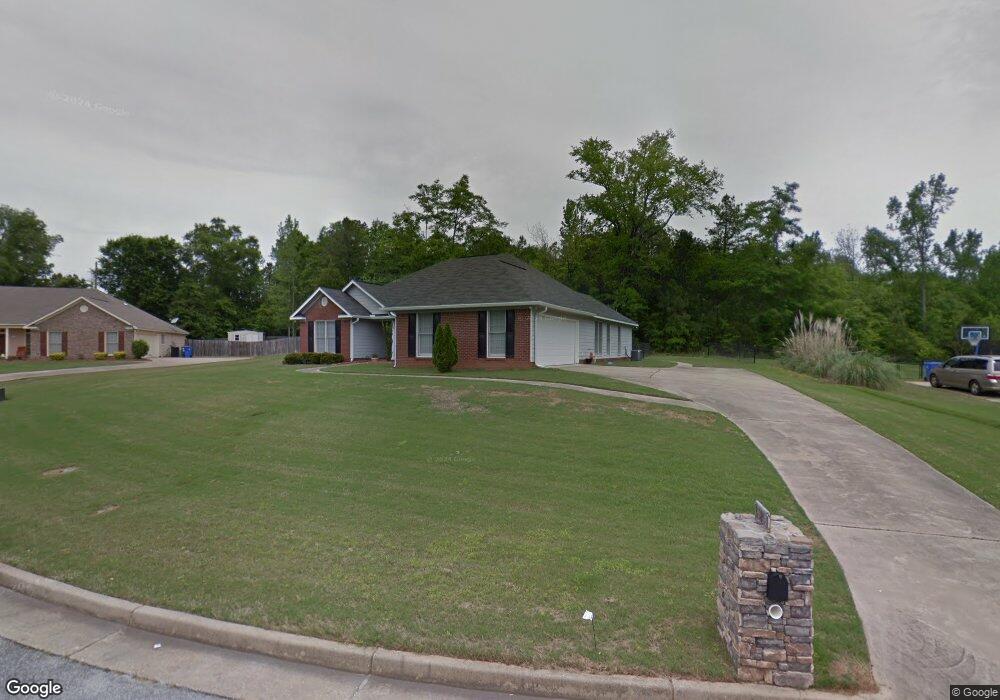
8020 Creek Flow Dr Midland, GA 31820
Midland NeighborhoodEstimated Value: $288,633 - $310,000
3
Beds
3
Baths
1,826
Sq Ft
$166/Sq Ft
Est. Value
About This Home
This home is located at 8020 Creek Flow Dr, Midland, GA 31820 and is currently estimated at $303,658, approximately $166 per square foot. 8020 Creek Flow Dr is a home located in Muscogee County with nearby schools including Mathews Elementary School, Aaron Cohn Middle School, and Shaw High School.
Ownership History
Date
Name
Owned For
Owner Type
Purchase Details
Closed on
Feb 19, 2024
Sold by
Webster Betty Jean and Spain Christine Shelton
Bought by
Spain Christine Shelton and Spain Tina Marie
Current Estimated Value
Purchase Details
Closed on
Jan 11, 2016
Sold by
Wells Fargo Bank
Bought by
Webster Betty Jean and Chritine Shelton Spain
Purchase Details
Closed on
Nov 3, 2015
Sold by
Hill Dothan
Bought by
Wells Fargo Bank
Purchase Details
Closed on
Aug 14, 2008
Sold by
Va
Bought by
Hill Dothan
Home Financials for this Owner
Home Financials are based on the most recent Mortgage that was taken out on this home.
Original Mortgage
$172,056
Interest Rate
6.49%
Purchase Details
Closed on
Jan 2, 2008
Sold by
Suntrust Mortgage Inc
Bought by
Va
Create a Home Valuation Report for This Property
The Home Valuation Report is an in-depth analysis detailing your home's value as well as a comparison with similar homes in the area
Home Values in the Area
Average Home Value in this Area
Purchase History
| Date | Buyer | Sale Price | Title Company |
|---|---|---|---|
| Spain Christine Shelton | -- | None Listed On Document | |
| Webster Betty Jean | $140,000 | -- | |
| Wells Fargo Bank | $135,520 | -- | |
| Hill Dothan | -- | None Available | |
| Va | -- | None Available | |
| Suntrust Mortgage Inc | $172,098 | None Available |
Source: Public Records
Mortgage History
| Date | Status | Borrower | Loan Amount |
|---|---|---|---|
| Previous Owner | Hill Dothan | $172,056 |
Source: Public Records
Tax History Compared to Growth
Tax History
| Year | Tax Paid | Tax Assessment Tax Assessment Total Assessment is a certain percentage of the fair market value that is determined by local assessors to be the total taxable value of land and additions on the property. | Land | Improvement |
|---|---|---|---|---|
| 2025 | $114 | $96,172 | $11,316 | $84,856 |
| 2024 | $687 | $96,172 | $11,316 | $84,856 |
| 2023 | $344 | $96,172 | $11,316 | $84,856 |
| 2022 | $1,202 | $80,912 | $11,316 | $69,596 |
| 2021 | $1,202 | $68,756 | $11,316 | $57,440 |
| 2020 | $1,203 | $68,756 | $11,316 | $57,440 |
| 2019 | $1,207 | $68,756 | $11,316 | $57,440 |
| 2018 | $1,207 | $68,756 | $11,316 | $57,440 |
| 2017 | $1,212 | $56,000 | $9,120 | $46,880 |
| 2016 | $2,381 | $67,511 | $11,600 | $55,911 |
| 2015 | $2,339 | $66,235 | $11,600 | $54,635 |
| 2014 | $2,343 | $66,235 | $11,600 | $54,635 |
| 2013 | -- | $66,235 | $11,600 | $54,635 |
Source: Public Records
Map
Nearby Homes
- 8013 Barton Dr
- 7107 Pine Seed Dr
- 9620 Hollow Pine Dr
- 9759 Pine Seed Ct
- 7133 Tall Pine Ct
- 7156 Tall Pine Ct
- 7390 Pine Tar Dr
- 7382 Pine Tar Dr
- 7337 Pine Tar Dr
- 7365 Pine Tar Dr
- 7312 Pine Chase Dr
- 7346 Pine Chase Dr
- 7300 Pine Chase Dr
- 7359 Pine Tar Dr
- 7381 Pine Tar Dr
- 7333 Pine Chase Dr
- 7343 Pine Chase Dr
- 7404 Prairie Valley Ct
- 8973 Orchard Valley Ln
- 4057 Pope Rd
- 8023 Creek Flow Dr
- 8018 Creek Flow Dr
- 8021 Creek Flow Dr
- 8017 Creek Flow Dr
- 8019 Creek Flow Dr
- 8016 Creek Flow Dr
- 9900 Macon Rd
- 8013 Creek Flow Dr
- 8014 Creek Flow Dr
- 4033 Hardwood Way
- 7004 Crib Ct
- 8011 Creek Flow Dr
- 9004 E East Lake Dr
- 8012 Creek Flow Dr
- 7000 Crib Ct
- 8010 Creek Flow Dr
- 7003 Crib Ct
- 4029 Hardwood Way
- 8009 Creek Flow Dr
- 9950 Macon Rd