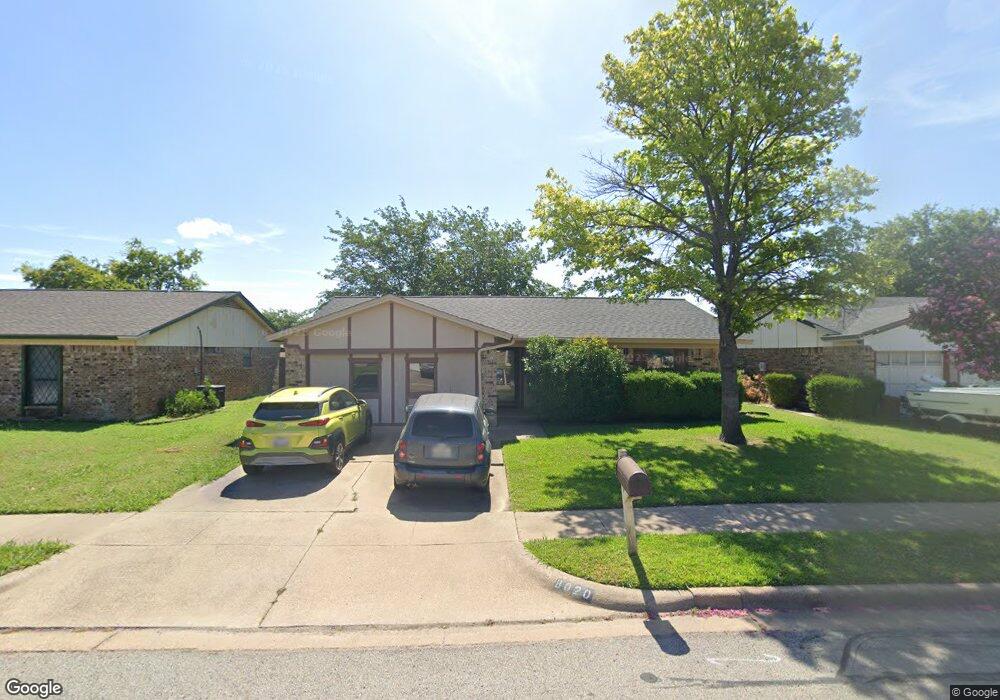
8020 Lazy Brook Dr Watauga, TX 76148
Estimated Value: $289,000 - $308,000
3
Beds
2
Baths
1,568
Sq Ft
$191/Sq Ft
Est. Value
About This Home
This home is located at 8020 Lazy Brook Dr, Watauga, TX 76148 and is currently estimated at $299,030, approximately $190 per square foot. 8020 Lazy Brook Dr is a home located in Tarrant County with nearby schools including North Ridge Elementary School, North Ridge Middle School, and Richland High School.
Ownership History
Date
Name
Owned For
Owner Type
Purchase Details
Closed on
Nov 12, 2019
Sold by
Clinkscales Keith and Estate Of Sherry A Clinkscales
Bought by
Clinkscales Keith and Gunn Brian Cameron
Current Estimated Value
Purchase Details
Closed on
Aug 1, 2002
Sold by
Boyd Joseph C
Bought by
Clinkscales Sherry
Home Financials for this Owner
Home Financials are based on the most recent Mortgage that was taken out on this home.
Original Mortgage
$64,148
Outstanding Balance
$27,105
Interest Rate
6.53%
Mortgage Type
FHA
Estimated Equity
$271,925
Purchase Details
Closed on
Jun 23, 2000
Sold by
Castro Marti Denise
Bought by
Boyd Joseph C
Home Financials for this Owner
Home Financials are based on the most recent Mortgage that was taken out on this home.
Original Mortgage
$61,200
Interest Rate
8.66%
Purchase Details
Closed on
May 4, 2000
Sold by
Lollman Paul
Bought by
Castro Marti Denise
Home Financials for this Owner
Home Financials are based on the most recent Mortgage that was taken out on this home.
Original Mortgage
$61,200
Interest Rate
8.66%
Purchase Details
Closed on
Jun 3, 1999
Sold by
Castro Leandro
Bought by
Castro Denise
Create a Home Valuation Report for This Property
The Home Valuation Report is an in-depth analysis detailing your home's value as well as a comparison with similar homes in the area
Home Values in the Area
Average Home Value in this Area
Purchase History
| Date | Buyer | Sale Price | Title Company |
|---|---|---|---|
| Clinkscales Keith | -- | None Available | |
| Clinkscales Sherry | -- | Commonwealth Land Title Ins | |
| Boyd Joseph C | -- | Rattikin Title Co | |
| Castro Marti Denise | -- | -- | |
| Castro Denise | -- | American Title Co |
Source: Public Records
Mortgage History
| Date | Status | Borrower | Loan Amount |
|---|---|---|---|
| Open | Clinkscales Sherry | $64,148 | |
| Previous Owner | Boyd Joseph C | $61,200 |
Source: Public Records
Tax History Compared to Growth
Tax History
| Year | Tax Paid | Tax Assessment Tax Assessment Total Assessment is a certain percentage of the fair market value that is determined by local assessors to be the total taxable value of land and additions on the property. | Land | Improvement |
|---|---|---|---|---|
| 2025 | $4,624 | $285,603 | $50,000 | $235,603 |
| 2024 | $4,624 | $285,603 | $50,000 | $235,603 |
| 2023 | $5,536 | $280,142 | $50,000 | $230,142 |
| 2022 | $5,373 | $228,701 | $30,000 | $198,701 |
| 2021 | $5,128 | $206,317 | $30,000 | $176,317 |
| 2020 | $4,668 | $182,852 | $30,000 | $152,852 |
| 2019 | $3,885 | $184,084 | $30,000 | $154,084 |
| 2018 | $1,809 | $133,274 | $30,000 | $103,274 |
| 2017 | $3,270 | $126,385 | $30,000 | $96,385 |
| 2016 | $2,973 | $110,144 | $13,000 | $97,144 |
| 2015 | $2,555 | $104,000 | $13,000 | $91,000 |
| 2014 | $2,555 | $104,000 | $13,000 | $91,000 |
Source: Public Records
Map
Nearby Homes
- 6552 Fairview Dr
- 6004 Bursey Rd
- 8205 April Ln
- 6468 Fairview Dr
- 6520 N Park Dr
- 6432 High Lawn Terrace
- 6436 Green Ridge Dr
- 6569 Westridge Dr
- 2133 Rim Rock Dr
- 6517 Ridglea Dr
- 6740 Old Mill Ct
- 2127 Rustic Ridge Dr
- 6705 Parkwood Dr
- 2143 Serene Ct
- 2122 Stoneridge Dr
- 8256 Lesley Ln
- 6413 Ridglea Dr
- 6048 Hillview Dr
- 6361 Hunters Glen Dr
- 2113 Rustic Ridge Dr
- 8016 Lazy Brook Dr
- 8024 Lazy Brook Dr
- 8021 Berrybrook Dr
- 8025 Berrybrook Dr
- 8012 Lazy Brook Dr
- 8017 Berrybrook Dr
- 8028 Lazy Brook Dr
- 8021 Lazy Brook Dr
- 8029 Berrybrook Dr
- 8017 Lazy Brook Dr
- 8013 Berrybrook Dr
- 8025 Lazy Brook Dr
- 8008 Lazy Brook Dr
- 8032 Lazy Brook Dr
- 8013 Lazy Brook Dr
- 8029 Lazy Brook Dr
- 8033 Berrybrook Dr
- 8009 Berrybrook Dr
- 8009 Lazy Brook Dr
- 8004 Lazy Brook Dr