
8020 Sleepy View Ln Springfield, VA 22153
Highlights
- View of Trees or Woods
- Deck
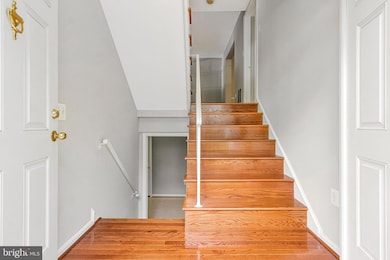
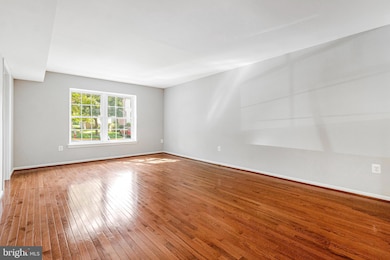
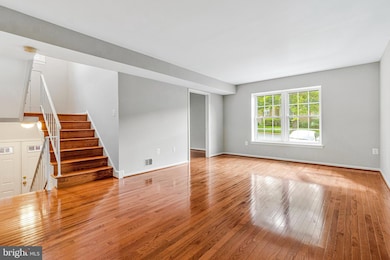
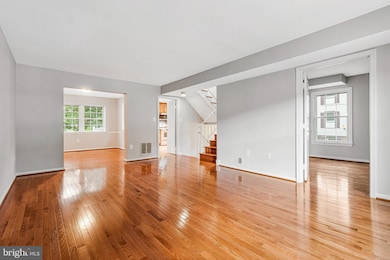
- Wood Flooring
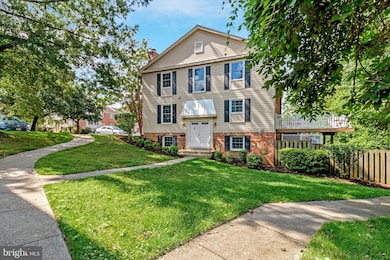
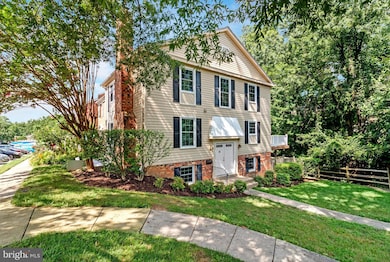
- Colonial Architecture
- Traditional Floor Plan
- 2-minute walk to Saratoga Recreation Group
About This Home
Beautifully updated end unit townhouse almost 2,500 s.f. on 3 levels, great light from windows on 3 sides, 2 reserved parking spaces, community pool with annual fee, totally renovated kitchen and 3.5 baths, wood floors on main and upper levels, tile floor on lower level, deck off of kitchen, and patio off of walk out recreation room, backs to wooded area, main level den could be 4th bedroom, plenty of space for home offices, Saratoga is conveniently located near the U.S. Government NGA Complex and the Park and Ride to either Springfield Metro or the Pentagon, and is 3 blocks to neighborhood shopping (grocery store, gas station, restaurants, coffee shop, and much more). Additional parking is available on Edinburg.
Listing Agent
(703) 967-6403 shottman1@gmail.com Malcolm Real Estate, Inc. License #0225187223 Listed on: 10/31/2025
Co-Listing Agent
(202) 333-8500 malcolmrealestate@yahoo.com Malcolm Real Estate, Inc. License #9898989
Townhouse Details
Home Type
- Townhome
Est. Annual Taxes
- $5,900
Year Built
- Built in 1979 | Remodeled in 2019
Lot Details
- 2,500 Sq Ft Lot
- East Facing Home
- Back Yard Fenced
- Board Fence
Parking
- 2 Assigned Parking Spaces
Property Views
- Woods
- Creek or Stream
Home Design
- Colonial Architecture
- Entry on the 2nd floor
- Slab Foundation
- Composition Roof
- Vinyl Siding
Interior Spaces
- Property has 3 Levels
- Traditional Floor Plan
- Wood Burning Fireplace
- Fireplace With Glass Doors
- Brick Fireplace
- Double Pane Windows
- Vinyl Clad Windows
- Double Hung Windows
- Sliding Windows
- Window Screens
- Formal Dining Room
- Natural lighting in basement
Kitchen
- Breakfast Area or Nook
- Eat-In Kitchen
- Electric Oven or Range
- Built-In Microwave
- Dishwasher
- Disposal
Flooring
- Wood
- Vinyl
Bedrooms and Bathrooms
- Walk-In Closet
- Bathtub with Shower
Laundry
- Laundry on lower level
- Electric Front Loading Dryer
- Washer
Outdoor Features
- Deck
- Patio
- Playground
Schools
- Saratoga Elementary School
- Lee High School
Utilities
- Central Air
- Heat Pump System
- 200+ Amp Service
- Electric Water Heater
- Phone Available
- Cable TV Available
Listing and Financial Details
- Residential Lease
- Security Deposit $3,150
- Tenant pays for fireplace/flue cleaning, frozen waterpipe damage, gutter cleaning, light bulbs/filters/fuses/alarm care, all utilities
- No Smoking Allowed
- 12-Month Min and 24-Month Max Lease Term
- Available 10/31/25
- $50 Application Fee
- $75 Repair Deductible
- Assessor Parcel Number 0982 08 0154A
Community Details
Overview
- Property has a Home Owners Association
- Association fees include common area maintenance, lawn maintenance, reserve funds, road maintenance, trash
- Townhouses Of Saratoga HOA
- Saratoga Townhouses Subdivision
Recreation
- Community Playground
- Community Pool
- Pool Membership Available
Pet Policy
- Limit on the number of pets
- Pet Size Limit
- Pet Deposit $500
- $50 Monthly Pet Rent
- Breed Restrictions
Map
Source: Bright MLS
MLS Number: VAFX2277034
APN: 0982-08-0154A
Disclaimer: Certain information contained herein is derived from information provided by parties other than Homes.com. All information provided is deemed reliable, but is not guaranteed to be accurate and should be independently verified.
![]() The data relating to real estate for sale on this website appears in part through the BRIGHT Internet Data Exchange program, a voluntary cooperative exchange of property listing data between licensed real estate brokerage firms, and is provided by BRIGHT through a licensing agreement.
The data relating to real estate for sale on this website appears in part through the BRIGHT Internet Data Exchange program, a voluntary cooperative exchange of property listing data between licensed real estate brokerage firms, and is provided by BRIGHT through a licensing agreement.
Listing information is from various brokers who participate in the Bright MLS IDX program and not all listings may be visible on the site.
The property information being provided on or through the website is for the personal, non-commercial use of consumers and such information may not be used for any purpose other than to identify prospective properties consumers may be interested in purchasing.
Some properties which appear for sale on the website may no longer be available because they are for instance, under contract, sold or are no longer being offered for sale.
Property information displayed is deemed reliable but is not guaranteed.
Copyright 2025 Bright MLS, Inc.
- 8000 Lady Lewis Ct
- 7865 Parthian Ct
- 8110 Northumberland Rd
- 8068 Dulciana Ct
- 7729 Middle Valley Dr
- 8408 Dampier Ct
- 7594 Woodstown Dr
- 8375 Magic Leaf Rd
- 8278 Crestmont Cir
- 8433 Sugar Creek Ln
- 8298 Lindside Way
- 7719 Durer Ct
- 7673 Northern Oaks Ct
- 8110 Winter Blue Ct
- 7757 Tara Heights Place
- 8566 Gwynedd Way
- 7730 Shadowcreek Terrace
- 7808 Tower Woods Dr
- 8580 Tyrolean Way
- 7310 Eggar Woods Ln
- 8132 Sleepy View Ln
- 8072 Sleepy View Ln
- 7609 Mulberry Bottom Ln
- 7713 Bristol Square Ct
- 8222 Maple Ridge Ave
- 7907 Forest Path Way
- 8018 Grandview Ct
- 8315 Brookvale Ct
- 8317 Brookvale Ct
- 8277 Crestmont Cir
- 7603 Woodstown Dr
- 8143 Ridge Creek Way
- 8474 Sugar Creek Ln
- 8353 Fern Leaf Ct
- 7753 Durer Ct
- 7426 Erska Woods Ct
- 7700 Shadowcreek Terrace
- 8499 Rainbow Bridge Ln
- 7810 Newington Woods Dr
- 8482 Springfield Oaks Dr
