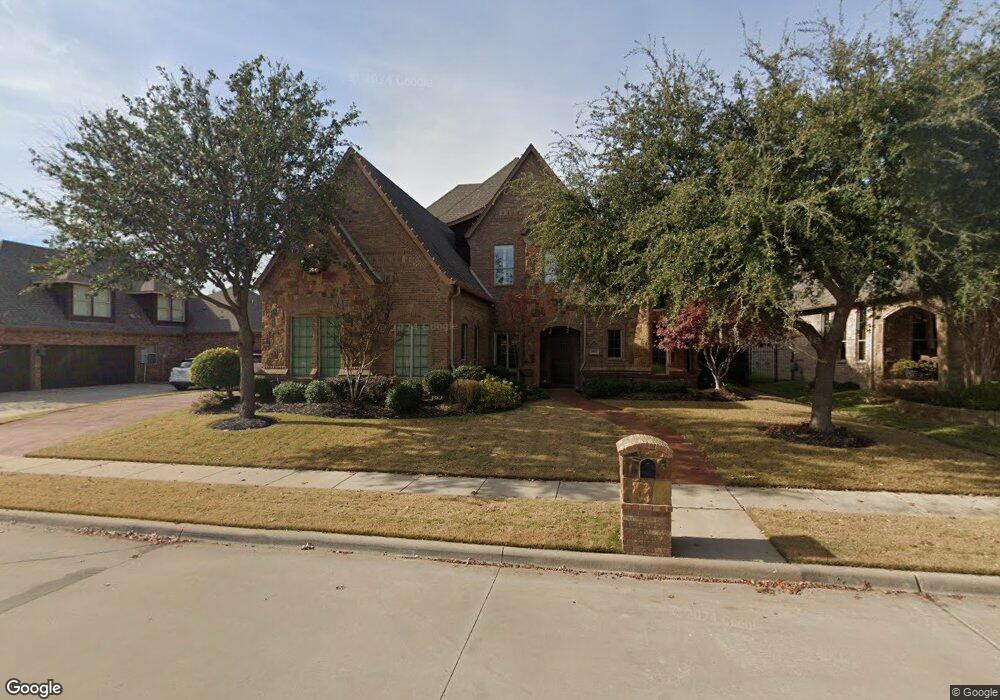
8021 Hallmark Dr North Richland Hills, TX 76182
Estimated Value: $876,657 - $1,026,000
4
Beds
4
Baths
4,567
Sq Ft
$210/Sq Ft
Est. Value
About This Home
This home is located at 8021 Hallmark Dr, North Richland Hills, TX 76182 and is currently estimated at $959,664, approximately $210 per square foot. 8021 Hallmark Dr is a home located in Tarrant County with nearby schools including W.A. Porter Elementary School, Smithfield Middle School, and Birdville High School.
Ownership History
Date
Name
Owned For
Owner Type
Purchase Details
Closed on
Jun 24, 2021
Sold by
Sdal Holdings Llc
Bought by
Sexton Susan Gail and Sexton Michael Ray
Current Estimated Value
Purchase Details
Closed on
May 16, 2012
Sold by
Pinney Amy and Phinney Erin
Bought by
Sesom Services Inc
Purchase Details
Closed on
Oct 20, 2008
Sold by
Sierra Fine Custom Homes
Bought by
Moses Stephen and Moses Catherine
Home Financials for this Owner
Home Financials are based on the most recent Mortgage that was taken out on this home.
Original Mortgage
$417,000
Interest Rate
6.35%
Mortgage Type
Purchase Money Mortgage
Purchase Details
Closed on
Oct 10, 2008
Sold by
J & J Nrh 100 Flp
Bought by
Sierra Fine Custom Homes
Home Financials for this Owner
Home Financials are based on the most recent Mortgage that was taken out on this home.
Original Mortgage
$417,000
Interest Rate
6.35%
Mortgage Type
Purchase Money Mortgage
Create a Home Valuation Report for This Property
The Home Valuation Report is an in-depth analysis detailing your home's value as well as a comparison with similar homes in the area
Home Values in the Area
Average Home Value in this Area
Purchase History
| Date | Buyer | Sale Price | Title Company |
|---|---|---|---|
| Sexton Susan Gail | -- | Wfg National Title Insurance C | |
| Sesom Services Inc | -- | None Available | |
| Moses Stephen | -- | Providence Title Company | |
| Sierra Fine Custom Homes | -- | Providence Title Company |
Source: Public Records
Mortgage History
| Date | Status | Borrower | Loan Amount |
|---|---|---|---|
| Previous Owner | Moses Stephen | $417,000 | |
| Previous Owner | Sierra Fine Custom Homes | $125,700 |
Source: Public Records
Tax History Compared to Growth
Tax History
| Year | Tax Paid | Tax Assessment Tax Assessment Total Assessment is a certain percentage of the fair market value that is determined by local assessors to be the total taxable value of land and additions on the property. | Land | Improvement |
|---|---|---|---|---|
| 2025 | $10,823 | $734,000 | $99,110 | $634,890 |
| 2024 | $10,823 | $861,694 | $99,110 | $762,584 |
| 2023 | $16,049 | $814,591 | $99,110 | $715,481 |
| 2022 | $16,005 | $725,515 | $99,110 | $626,405 |
| 2021 | $15,386 | $604,635 | $100,000 | $504,635 |
| 2020 | $15,385 | $604,635 | $100,000 | $504,635 |
| 2019 | $16,310 | $619,347 | $85,000 | $534,347 |
| 2018 | $15,471 | $622,008 | $85,000 | $537,008 |
| 2017 | $15,336 | $570,000 | $100,000 | $470,000 |
| 2016 | $14,220 | $528,515 | $100,000 | $428,515 |
| 2015 | $12,409 | $486,500 | $60,000 | $426,500 |
| 2014 | $12,409 | $486,500 | $60,000 | $426,500 |
Source: Public Records
Map
Nearby Homes
- 7908 Hallmark Dr
- 7905 Hallmark Dr
- 8932 Thornberry Dr
- 8113 Biscayne Ct
- 8205 Edgemont Ct
- 8200 Thornhill Dr
- 8315 Thornridge Dr
- 8312 Thornway Ct
- 9216 Cachelle Ct
- 5918 Crescent Ln
- 9216 Hailey Ct
- 5903 Crescent Ln
- 6112 Emmas Ct
- Bolsins Plan at Adkins Park
- Bellhaven Plan at Adkins Park
- 3404 Osprey Dr
- Grady Plan at Adkins Park
- 701 Corsair Ct
- Hillman Plan at Adkins Park
- Kenney Plan at Adkins Park
- 8017 Hallmark Dr
- 8101 Hallmark Dr
- 8013 Hallmark Dr
- 8105 Hallmark Dr
- 8016 Hallmark Dr
- 9100 Belaire Dr
- 8012 Hallmark Dr
- 8009 Hallmark Dr
- 9104 Belaire Dr
- 8953 Stratford Dr
- 8109 Hallmark Dr
- 9012 Thornberry Dr
- 8008 Hallmark Dr
- 8108 Hallmark Dr
- 8005 Hallmark Dr
- 8950 Stratford Dr
- 9108 Belaire Dr
- 104 Mary Grace Ct
- 8113 Hallmark Dr
- 8004 Hallmark Dr