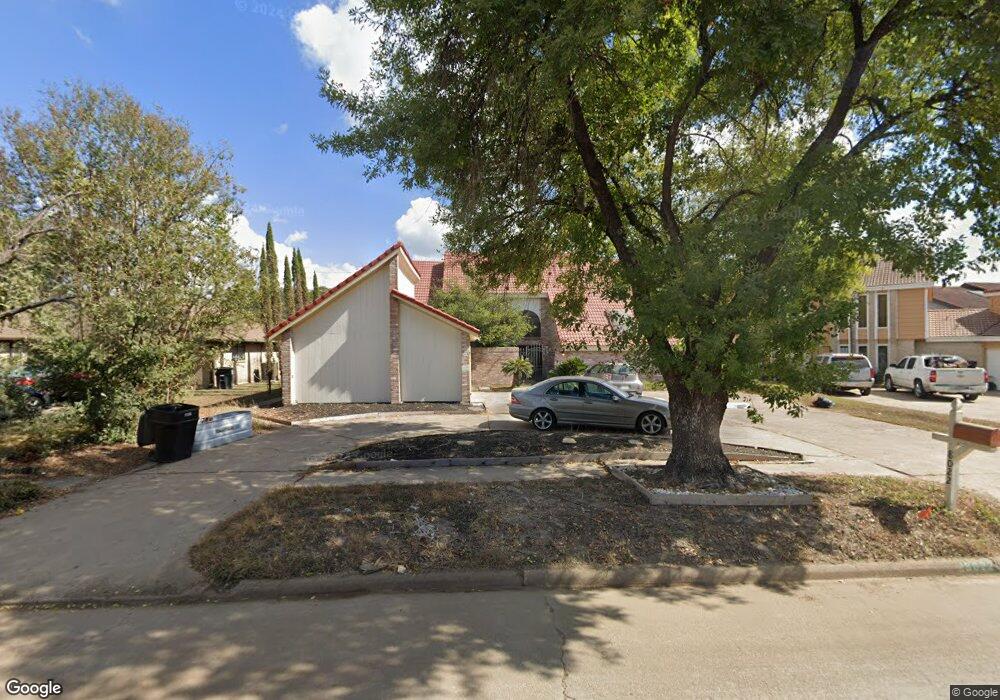
8022 Green Lawn Dr Houston, TX 77088
Greater Inwood NeighborhoodEstimated Value: $295,000 - $326,666
4
Beds
4
Baths
2,925
Sq Ft
$107/Sq Ft
Est. Value
About This Home
This home is located at 8022 Green Lawn Dr, Houston, TX 77088 and is currently estimated at $311,917, approximately $106 per square foot. 8022 Green Lawn Dr is a home located in Harris County with nearby schools including Edward a Vines EC/Pre-K/K School, J. Ruth Smith Elementary, and Hoffman Middle School.
Ownership History
Date
Name
Owned For
Owner Type
Purchase Details
Closed on
Jun 29, 2022
Sold by
Shah Narendra N and Shah Ila
Bought by
Serpa Mitzi Graciela Bla
Current Estimated Value
Home Financials for this Owner
Home Financials are based on the most recent Mortgage that was taken out on this home.
Original Mortgage
$235,000
Outstanding Balance
$223,595
Interest Rate
5.1%
Mortgage Type
Seller Take Back
Estimated Equity
$88,322
Purchase Details
Closed on
May 30, 2019
Sold by
Cordova Rosa T and Cordova Jose M
Bought by
Nata Verlal Shah Narendra
Purchase Details
Closed on
Jan 15, 2015
Sold by
Bernal Jose A
Bought by
Cordova Rosa T and Cordova Jose Maximo
Home Financials for this Owner
Home Financials are based on the most recent Mortgage that was taken out on this home.
Original Mortgage
$176,739
Interest Rate
4.4%
Mortgage Type
FHA
Purchase Details
Closed on
Sep 14, 2001
Sold by
Mitchell Melissa G and Rooke Donald H
Bought by
Bernal Jose A
Create a Home Valuation Report for This Property
The Home Valuation Report is an in-depth analysis detailing your home's value as well as a comparison with similar homes in the area
Home Values in the Area
Average Home Value in this Area
Purchase History
| Date | Buyer | Sale Price | Title Company |
|---|---|---|---|
| Serpa Mitzi Graciela Bla | -- | None Listed On Document | |
| Nata Verlal Shah Narendra | -- | None Available | |
| Cordova Rosa T | -- | None Available | |
| Bernal Jose A | -- | Chicago Title |
Source: Public Records
Mortgage History
| Date | Status | Borrower | Loan Amount |
|---|---|---|---|
| Open | Serpa Mitzi Graciela Bla | $235,000 | |
| Previous Owner | Cordova Rosa T | $176,739 |
Source: Public Records
Tax History Compared to Growth
Tax History
| Year | Tax Paid | Tax Assessment Tax Assessment Total Assessment is a certain percentage of the fair market value that is determined by local assessors to be the total taxable value of land and additions on the property. | Land | Improvement |
|---|---|---|---|---|
| 2025 | $7,180 | $295,307 | $49,329 | $245,978 |
| 2024 | $7,180 | $316,353 | $49,329 | $267,024 |
| 2023 | $7,180 | $316,353 | $49,329 | $267,024 |
| 2022 | $5,848 | $243,819 | $41,108 | $202,711 |
| 2021 | $5,514 | $219,515 | $41,108 | $178,407 |
| 2020 | $5,833 | $221,000 | $41,108 | $179,892 |
| 2019 | $6,125 | $221,342 | $21,924 | $199,418 |
| 2018 | $2,888 | $201,159 | $21,924 | $179,235 |
| 2017 | $5,336 | $201,159 | $21,924 | $179,235 |
| 2016 | $5,012 | $188,929 | $21,924 | $167,005 |
| 2015 | $3,381 | $184,544 | $21,924 | $162,620 |
| 2014 | $3,381 | $148,646 | $21,924 | $126,722 |
Source: Public Records
Map
Nearby Homes
- 6011 Green Falls Dr
- 7868 Green Lawn Dr Unit 7868
- 5935 Caruso Forest Dr
- 7840 Bateman Ln Unit 7840
- 6023 Elkwood Forest Dr
- 7750 Green Lawn Dr
- 0 Antoine Dr
- 5942 Caruso Forest Dr
- 7736 Challie Ln
- 6114 Elkwood Forest Dr
- 6303 Greenway Forest Ln
- 7727 Green Lawn Dr
- 7728 Challie Ln
- 32 Regency Ln
- 6122 Gallant Forest Dr
- 5638 Hickory Forest Dr
- 7402 Alabonson Rd Unit 506
- 7402 Alabonson Rd Unit 309
- 7402 Alabonson Rd Unit 510
- 7402 Alabonson Rd Unit 108
- 8102 Green Lawn Dr
- 8018 Green Lawn Dr
- 8019 Wray Ct
- 8015 Wray Ct
- 8014 Green Lawn Dr
- 8106 Green Lawn Dr
- 8011 Wray Ct
- 8019 Green Lawn Dr
- 8059 Zimmermann Dr
- 8023 Wray Ct
- 8010 Green Lawn Dr
- 8007 Wray Ct
- 8055 Zimmermann Dr
- 8011 Green Lawn Dr
- 5930 Green Falls Dr
- 8022 Wray Ct
- 8034 Zimmermann Dr
- 5926 Green Falls Dr
- 8051 Zimmermann Dr
- 5934 Green Falls Dr