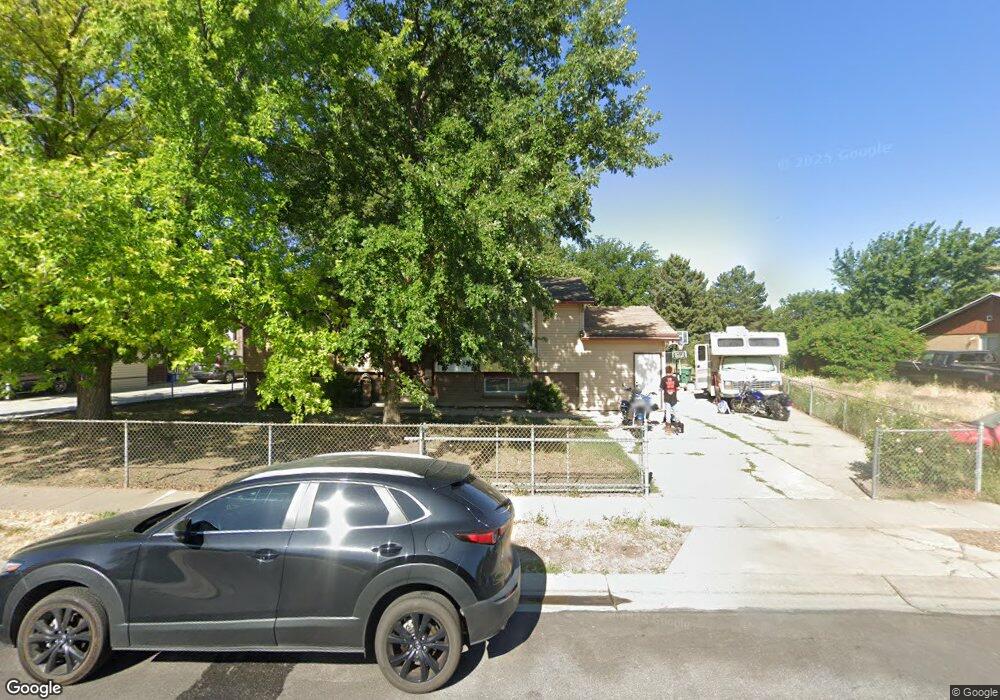
8022 Laguna Dr West Jordan, UT 84088
Estimated Value: $456,000 - $545,000
4
Beds
3
Baths
1,008
Sq Ft
$487/Sq Ft
Est. Value
About This Home
This home is located at 8022 Laguna Dr, West Jordan, UT 84088 and is currently estimated at $490,820, approximately $486 per square foot. 8022 Laguna Dr is a home located in Salt Lake County with nearby schools including Westvale Elementary School, West Jordan Middle School, and West Jordan High School.
Ownership History
Date
Name
Owned For
Owner Type
Purchase Details
Closed on
Jan 21, 2022
Sold by
Lance Lambros
Bought by
Lambros Kirstyn
Current Estimated Value
Purchase Details
Closed on
Jul 13, 2018
Sold by
Lambros Darnell Yvonne
Bought by
Lambros Lance E
Purchase Details
Closed on
Aug 21, 2013
Sold by
Lambros Lance E
Bought by
Lambros Lance E and Lambros Darnell Yvonne
Purchase Details
Closed on
Jun 29, 2010
Sold by
David Mary J
Bought by
Lambros Lance E
Home Financials for this Owner
Home Financials are based on the most recent Mortgage that was taken out on this home.
Original Mortgage
$153,174
Interest Rate
5.5%
Mortgage Type
FHA
Create a Home Valuation Report for This Property
The Home Valuation Report is an in-depth analysis detailing your home's value as well as a comparison with similar homes in the area
Home Values in the Area
Average Home Value in this Area
Purchase History
| Date | Buyer | Sale Price | Title Company |
|---|---|---|---|
| Lambros Kirstyn | -- | None Listed On Document | |
| Lambros Kirstyn | -- | None Listed On Document | |
| Lambros Lance E | -- | None Available | |
| Lambros Lance E | -- | Accommodation | |
| Lambros Lance E | -- | Us Title Park City |
Source: Public Records
Mortgage History
| Date | Status | Borrower | Loan Amount |
|---|---|---|---|
| Previous Owner | Lambros Lance E | $153,174 |
Source: Public Records
Tax History Compared to Growth
Tax History
| Year | Tax Paid | Tax Assessment Tax Assessment Total Assessment is a certain percentage of the fair market value that is determined by local assessors to be the total taxable value of land and additions on the property. | Land | Improvement |
|---|---|---|---|---|
| 2025 | $2,157 | $430,000 | $152,500 | $277,500 |
| 2024 | $2,157 | $415,000 | $147,200 | $267,800 |
| 2023 | $2,065 | $374,400 | $140,100 | $234,300 |
| 2022 | $2,149 | $383,400 | $137,400 | $246,000 |
| 2021 | $1,800 | $292,300 | $112,100 | $180,200 |
| 2020 | $1,711 | $260,700 | $112,100 | $148,600 |
| 2019 | $1,712 | $255,800 | $112,100 | $143,700 |
| 2018 | $1,564 | $231,900 | $84,600 | $147,300 |
| 2017 | $1,459 | $215,300 | $84,600 | $130,700 |
| 2016 | $1,427 | $197,900 | $84,600 | $113,300 |
| 2015 | $1,438 | $194,400 | $96,700 | $97,700 |
| 2014 | $1,376 | $183,200 | $92,000 | $91,200 |
Source: Public Records
Map
Nearby Homes
- 8026 Laguna Cir
- 8140 S 2245 W
- 2497 Bueno Vista Dr
- 14 San Miguel St
- 7968 S 2700 W
- 48 San Rafael Ct
- 2386 W 7680 S
- 7993 S 2760 W
- 2062 W 7705 S
- 8383 S 2200 W
- 7647 S 2500 W
- 77 Rio Bravo Place
- 7942 S 2800 W
- 2169 W 7600 S
- 1790 W Sugar Factory Rd
- 8461 S 2385 W
- 7645 S 1960 W
- 1829 W 7600 S Unit G301
- 1829 W 7600 S Unit G303
- Tundra Plan at Hidden Cove
- 8008 Laguna Dr
- 8008 S Laguna Dr
- 8027 Laguna Dr
- 8037 Laguna Cir
- 8048 Laguna Dr
- 8025 S Laguna Cir
- 8025 Laguna Cir
- 8049 Laguna Cir
- 8049 S Laguna Cir
- 7994 Laguna Dr
- 8023 Laguna Dr
- 8023 S Laguna Dr
- 8009 Laguna Dr
- 8009 S Laguna Dr
- 7330 Laguna Cir
- 7995 Laguna Dr
- 2366 Bueno Vista Dr
- 7982 S Laguna Dr
- 7982 Laguna Dr
- 8059 Laguna Cir