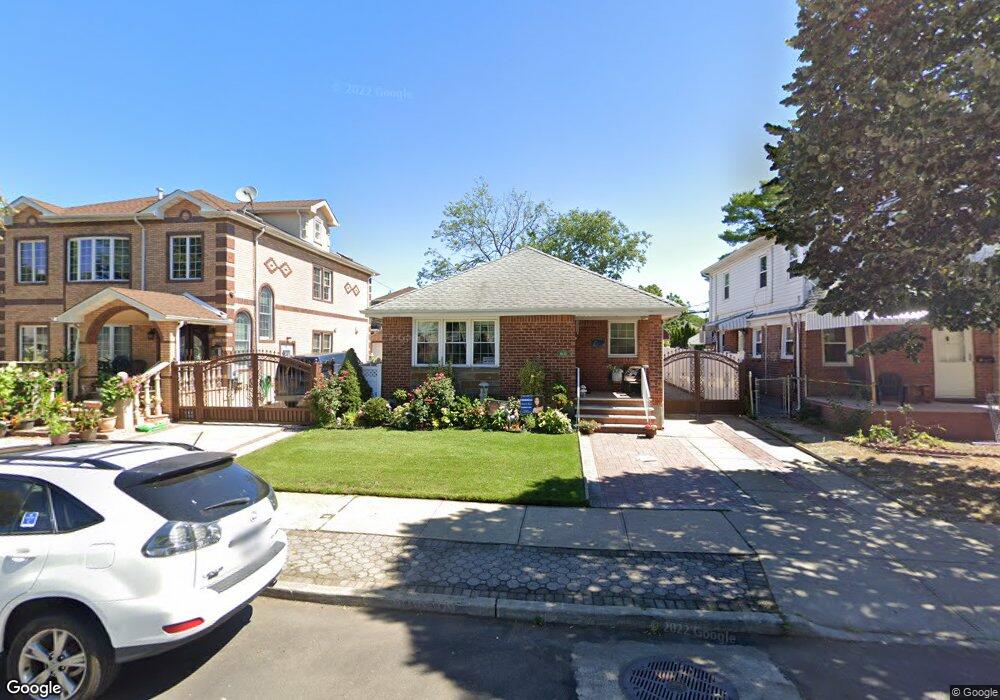
8023 256th St Glen Oaks, NY 11004
Estimated Value: $836,000 - $905,000
--
Bed
--
Bath
1,122
Sq Ft
$782/Sq Ft
Est. Value
About This Home
This home is located at 8023 256th St, Glen Oaks, NY 11004 and is currently estimated at $877,866, approximately $782 per square foot. 8023 256th St is a home located in Queens County with nearby schools including P.S.115Q James J Ambrose School, Fremont/Hay Elementary School, and Irwin Altman Middle School 172.
Ownership History
Date
Name
Owned For
Owner Type
Purchase Details
Closed on
Apr 21, 2018
Sold by
Kaur Rajni and Singh Harpreet
Bought by
Kaur Rajni
Current Estimated Value
Purchase Details
Closed on
Aug 31, 2011
Sold by
Shah Ajitkumar K and Shah Divya A
Bought by
Kaur Rajni and Singh Harpreet
Home Financials for this Owner
Home Financials are based on the most recent Mortgage that was taken out on this home.
Original Mortgage
$298,000
Interest Rate
4.38%
Mortgage Type
Purchase Money Mortgage
Purchase Details
Closed on
Jan 23, 2006
Sold by
Ceslik Carolyn and Ceslik Joseph
Bought by
Shah Ajitkumar K and Shah Divya A
Home Financials for this Owner
Home Financials are based on the most recent Mortgage that was taken out on this home.
Original Mortgage
$417,000
Interest Rate
6.31%
Mortgage Type
Purchase Money Mortgage
Create a Home Valuation Report for This Property
The Home Valuation Report is an in-depth analysis detailing your home's value as well as a comparison with similar homes in the area
Home Values in the Area
Average Home Value in this Area
Purchase History
| Date | Buyer | Sale Price | Title Company |
|---|---|---|---|
| Kaur Rajni | -- | -- | |
| Kaur Rajni | $505,000 | -- | |
| Kaur Rajni | $505,000 | -- | |
| Shah Ajitkumar K | $562,000 | -- | |
| Shah Ajitkumar K | $562,000 | -- |
Source: Public Records
Mortgage History
| Date | Status | Borrower | Loan Amount |
|---|---|---|---|
| Previous Owner | Kaur Rajni | $298,000 | |
| Previous Owner | Shah Ajitkumar K | $417,000 |
Source: Public Records
Tax History Compared to Growth
Tax History
| Year | Tax Paid | Tax Assessment Tax Assessment Total Assessment is a certain percentage of the fair market value that is determined by local assessors to be the total taxable value of land and additions on the property. | Land | Improvement |
|---|---|---|---|---|
| 2025 | $9,068 | $45,965 | $15,076 | $30,889 |
| 2024 | $9,068 | $45,149 | $15,699 | $29,450 |
| 2023 | $8,555 | $42,595 | $15,436 | $27,159 |
| 2022 | $8,245 | $45,780 | $15,960 | $29,820 |
| 2021 | $8,200 | $42,840 | $15,960 | $26,880 |
| 2020 | $8,108 | $40,320 | $15,960 | $24,360 |
| 2019 | $7,871 | $41,100 | $15,960 | $25,140 |
| 2018 | $7,236 | $35,496 | $14,415 | $21,081 |
| 2017 | $7,016 | $34,419 | $15,650 | $18,769 |
| 2016 | $6,491 | $34,419 | $15,650 | $18,769 |
| 2015 | $3,916 | $31,920 | $17,700 | $14,220 |
| 2014 | $3,916 | $31,354 | $17,386 | $13,968 |
Source: Public Records
Map
Nearby Homes
- 80-27 257th St
- 8125 258th St
- 80-37 259th St
- 80-18 261st St
- 8133 260th St
- 8017 252nd St
- 8127 252nd St
- 8211 260th St
- 8132 252nd St
- 7734 Little Neck Pkwy
- 254-61 75th Ave Unit A11-1
- 8143 262nd St
- 7719 252nd St
- 252-14 82nd Rd
- 250-12 81st Ave
- 258-15 83rd Ave
- 82-16 251st St
- 81-42 250th St
- 80-01 249th St
- 81-56 264th St