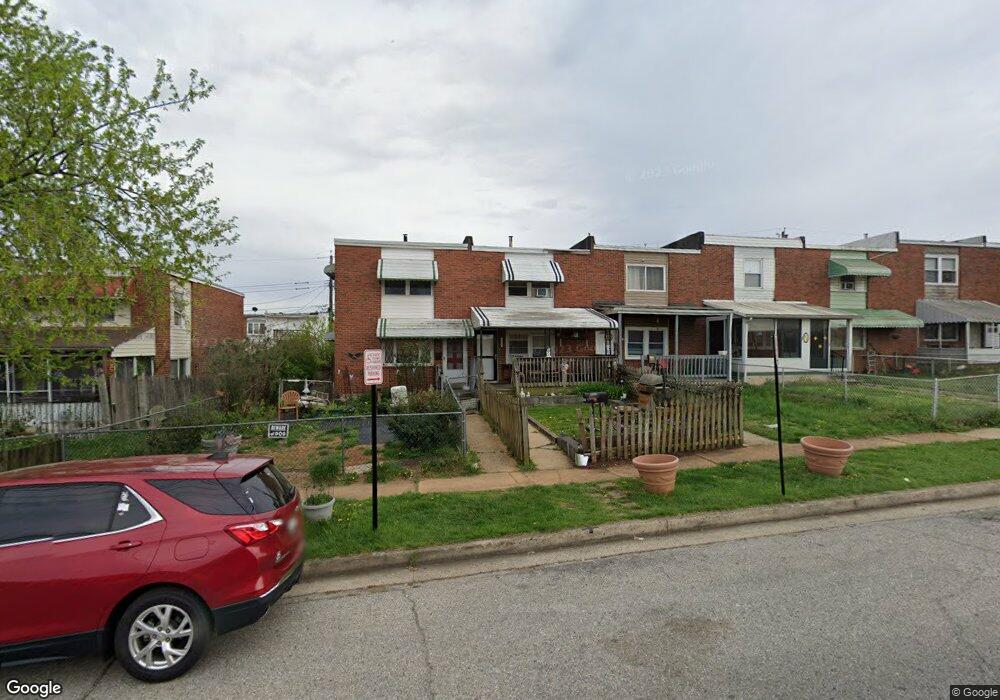
8023 E Baltimore St Baltimore, MD 21224
Estimated Value: $137,423 - $148,000
Studio
1
Bath
896
Sq Ft
$159/Sq Ft
Est. Value
About This Home
This home is located at 8023 E Baltimore St, Baltimore, MD 21224 and is currently estimated at $142,106, approximately $158 per square foot. 8023 E Baltimore St is a home located in Baltimore County with nearby schools including Colgate Elementary, Holabird Middle School, and Dundalk High School.
Ownership History
Date
Name
Owned For
Owner Type
Purchase Details
Closed on
Aug 9, 2007
Sold by
Coleburn James V
Bought by
Coleburn James V and Coleburn Carol A
Current Estimated Value
Home Financials for this Owner
Home Financials are based on the most recent Mortgage that was taken out on this home.
Original Mortgage
$105,750
Outstanding Balance
$77,346
Interest Rate
9.99%
Mortgage Type
Purchase Money Mortgage
Estimated Equity
$64,760
Purchase Details
Closed on
Jan 17, 2007
Sold by
Coleburn James V
Bought by
Coleburn James V and Coleburn Carol A
Home Financials for this Owner
Home Financials are based on the most recent Mortgage that was taken out on this home.
Original Mortgage
$105,750
Interest Rate
9.99%
Mortgage Type
Purchase Money Mortgage
Purchase Details
Closed on
Jun 26, 1996
Sold by
Koch Mary Lou
Bought by
Coleburn James V and Deardorff Carol A
Purchase Details
Closed on
Mar 9, 1988
Sold by
Walters Dorothy M
Bought by
Koch Mary Lou
Create a Home Valuation Report for This Property
The Home Valuation Report is an in-depth analysis detailing your home's value as well as a comparison with similar homes in the area
Home Values in the Area
Average Home Value in this Area
Purchase History
| Date | Buyer | Sale Price | Title Company |
|---|---|---|---|
| Coleburn James V | -- | -- | |
| Coleburn James V | -- | -- | |
| Coleburn James V | $62,500 | -- | |
| Koch Mary Lou | $46,000 | -- |
Source: Public Records
Mortgage History
| Date | Status | Borrower | Loan Amount |
|---|---|---|---|
| Open | Coleburn James V | $105,750 | |
| Previous Owner | Coleburn James V | $105,750 |
Source: Public Records
Tax History
| Year | Tax Paid | Tax Assessment Tax Assessment Total Assessment is a certain percentage of the fair market value that is determined by local assessors to be the total taxable value of land and additions on the property. | Land | Improvement |
|---|---|---|---|---|
| 2025 | $2,250 | $111,233 | -- | -- |
| 2024 | $2,250 | $104,667 | $0 | $0 |
| 2023 | $1,074 | $98,100 | $40,000 | $58,100 |
| 2022 | $2,131 | $93,933 | $0 | $0 |
| 2021 | $2,390 | $89,767 | $0 | $0 |
| 2020 | $2,390 | $85,600 | $40,000 | $45,600 |
| 2019 | $2,185 | $85,200 | $0 | $0 |
| 2018 | $2,080 | $84,800 | $0 | $0 |
| 2017 | $1,966 | $84,400 | $0 | $0 |
| 2016 | $1,619 | $84,400 | $0 | $0 |
| 2015 | $1,619 | $84,400 | $0 | $0 |
| 2014 | $1,619 | $89,200 | $0 | $0 |
Source: Public Records
Map
Nearby Homes
- 7956 Eastdale Rd
- 8012 Wynbrook Rd
- 8013 Gough St
- 8019 Gough St
- 8049 Lansdale Rd
- 7820 Wynbrook Rd
- 8031 Bank St
- 7746 Eastdale Rd
- 472 Mirabile Ln
- 462 Mirabile Ln
- 619 N Point Rd
- 410 Mirabile Ln
- 7627 Carson Ave
- 7316 Conley St
- 7836 Oakdale Ave
- 7307 Conley St
- 7515 Belmont Ave
- 7506 Belmont Ave
- 7503 Cypress Ave
- 7853 Oakdale Ave
- 8021 E Baltimore St
- 8025 E Baltimore St
- 8019 E Baltimore St
- 8017 E Baltimore St
- 8027 E Baltimore St
- 8015 E Baltimore St
- 8029 E Baltimore St
- 8031 E Baltimore St
- 8013 E Baltimore St
- 8033 E Baltimore St
- 8011 E Baltimore St
- 8035 E Baltimore St
- 8022 Eastdale Rd
- 8020 Eastdale Rd
- 8024 Eastdale Rd
- 8018 Eastdale Rd
- 8016 Eastdale Rd
- 8026 Eastdale Rd
- 8037 E Baltimore St
- 8014 Eastdale Rd
Your Personal Tour Guide
Ask me questions while you tour the home.