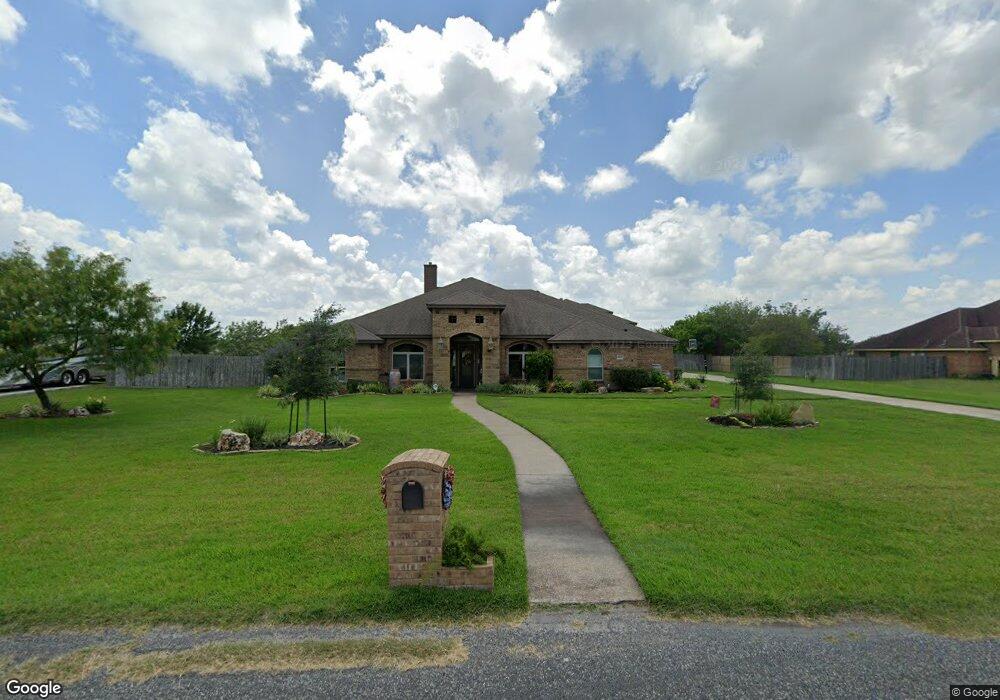
8025 Corinth Dr Unit 4 Corpus Christi, TX 78413
Southside NeighborhoodEstimated Value: $787,907 - $961,000
--
Bed
--
Bath
3,831
Sq Ft
$224/Sq Ft
Est. Value
About This Home
This home is located at 8025 Corinth Dr Unit 4, Corpus Christi, TX 78413 and is currently estimated at $857,727, approximately $223 per square foot. 8025 Corinth Dr Unit 4 is a home located in Nueces County with nearby schools including London Elementary School, London Middle, and London High School.
Ownership History
Date
Name
Owned For
Owner Type
Purchase Details
Closed on
Mar 14, 2013
Sold by
Live Oak Construction Inc
Bought by
Leonard Stanley J and Leonard Najjla E
Current Estimated Value
Home Financials for this Owner
Home Financials are based on the most recent Mortgage that was taken out on this home.
Original Mortgage
$417,000
Outstanding Balance
$276,482
Interest Rate
2.25%
Mortgage Type
Adjustable Rate Mortgage/ARM
Estimated Equity
$581,245
Purchase Details
Closed on
Jun 14, 2012
Sold by
Lozano Ayer Cynthia A
Bought by
Live Oak Construction Inc
Home Financials for this Owner
Home Financials are based on the most recent Mortgage that was taken out on this home.
Original Mortgage
$429,253
Interest Rate
3.86%
Mortgage Type
Purchase Money Mortgage
Purchase Details
Closed on
May 1, 2012
Sold by
Ys Inc
Bought by
Lozano Ayer Cynthia A
Home Financials for this Owner
Home Financials are based on the most recent Mortgage that was taken out on this home.
Original Mortgage
$429,253
Interest Rate
3.86%
Mortgage Type
Purchase Money Mortgage
Create a Home Valuation Report for This Property
The Home Valuation Report is an in-depth analysis detailing your home's value as well as a comparison with similar homes in the area
Home Values in the Area
Average Home Value in this Area
Purchase History
| Date | Buyer | Sale Price | Title Company |
|---|---|---|---|
| Leonard Stanley J | -- | None Available | |
| Live Oak Construction Inc | -- | Security Title | |
| Lozano Ayer Cynthia A | -- | Security Title |
Source: Public Records
Mortgage History
| Date | Status | Borrower | Loan Amount |
|---|---|---|---|
| Open | Leonard Stanley J | $417,000 | |
| Previous Owner | Live Oak Construction Inc | $429,253 |
Source: Public Records
Tax History Compared to Growth
Tax History
| Year | Tax Paid | Tax Assessment Tax Assessment Total Assessment is a certain percentage of the fair market value that is determined by local assessors to be the total taxable value of land and additions on the property. | Land | Improvement |
|---|---|---|---|---|
| 2025 | $13,081 | $715,547 | -- | -- |
| 2024 | $15,503 | $650,497 | $0 | $0 |
| 2023 | $11,867 | $591,361 | $0 | $0 |
| 2022 | $14,147 | $537,601 | $112,260 | $425,341 |
| 2021 | $13,149 | $491,427 | $77,182 | $414,245 |
| 2020 | $12,673 | $469,625 | $77,182 | $392,443 |
| 2019 | $12,706 | $480,837 | $77,182 | $403,655 |
| 2018 | $12,824 | $485,043 | $77,182 | $407,861 |
| 2017 | $13,717 | $518,634 | $77,182 | $441,452 |
| 2016 | $13,574 | $513,226 | $77,182 | $436,044 |
| 2015 | $13,308 | $548,602 | $77,182 | $471,420 |
| 2014 | $13,308 | $531,010 | $68,161 | $462,849 |
Source: Public Records
Map
Nearby Homes
- 8101 Mt Zion
- 4549 Jericho Rd
- 8102 Nazareth Dr
- 4642 Barnard Dr
- 4718 Canaan Place
- 5030 S Oso Pkwy
- 4641 Barnard Dr
- 5310 Capernaum Ct
- 4950 Deer Park Rd
- 5402 Bonanza Dr
- 5409 Bonanza Dr
- 5325 Wild Olive Trail
- 641 Hyacinth Dr
- 2002 Arash Dr
- 2021 Great Falls Dr
- 705 Battle Creek Dr
- 734 Buffalo Creek Dr
- 5514 Kitty Hawk Dr
- 729 Battle Creek Dr
- 5614 Kitty Hawk Dr
- 8025 Corinth Dr
- 8033 Corinth Dr
- 8017 Corinth Dr
- 8110 Galatia Dr
- 8026 Corinth Dr
- 8101 Corinth Dr
- 8018 Corinth Dr
- 8118 Galatia Dr
- 8102 Galatia Dr
- 8034 Corinth Dr
- 8010 Corinth Dr
- 4533 Mars Hill Dr
- 8109 Corinth Dr
- 8126 Galatia Dr
- 4541 Mars Hill Dr
- 8102 Corinth Dr
- 4510 Antioch Cir
- 0 Corinth Dr
- 8133 Corinth Dr
- 4517 Mars Hill Dr