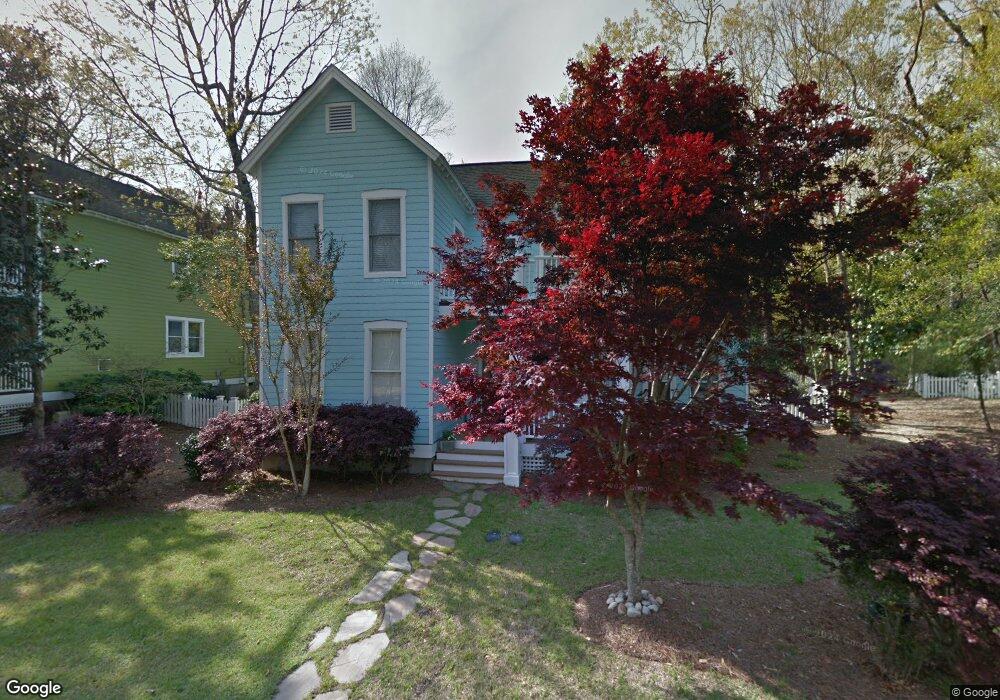
8025 Reunion Rd Wilmington, NC 28411
Estimated Value: $732,176 - $1,077,000
3
Beds
4
Baths
2,162
Sq Ft
$385/Sq Ft
Est. Value
About This Home
This home is located at 8025 Reunion Rd, Wilmington, NC 28411 and is currently estimated at $831,794, approximately $384 per square foot. 8025 Reunion Rd is a home located in New Hanover County with nearby schools including Porters Neck Elementary School, Holly Shelter Middle School, and Emsley A. Laney High School.
Ownership History
Date
Name
Owned For
Owner Type
Purchase Details
Closed on
Sep 27, 2018
Sold by
Lamporte Peter S and Lamporte Allison B
Bought by
Evans Sean Christopher and Evans Candance Grace
Current Estimated Value
Home Financials for this Owner
Home Financials are based on the most recent Mortgage that was taken out on this home.
Original Mortgage
$384,750
Outstanding Balance
$335,525
Interest Rate
4.5%
Mortgage Type
New Conventional
Estimated Equity
$496,269
Purchase Details
Closed on
Mar 16, 2005
Sold by
Double L Developers Llc
Bought by
Lamporte Peter S and Lamporte Allison B
Home Financials for this Owner
Home Financials are based on the most recent Mortgage that was taken out on this home.
Original Mortgage
$32,100
Interest Rate
5.79%
Mortgage Type
Credit Line Revolving
Purchase Details
Closed on
Sep 5, 1997
Sold by
Hallway Llc
Bought by
Double L Developers Llc
Create a Home Valuation Report for This Property
The Home Valuation Report is an in-depth analysis detailing your home's value as well as a comparison with similar homes in the area
Home Values in the Area
Average Home Value in this Area
Purchase History
| Date | Buyer | Sale Price | Title Company |
|---|---|---|---|
| Evans Sean Christopher | $405,000 | None Available | |
| Lamporte Peter S | $321,500 | None Available | |
| Double L Developers Llc | $1,033,500 | -- |
Source: Public Records
Mortgage History
| Date | Status | Borrower | Loan Amount |
|---|---|---|---|
| Open | Evans Sean Christopher | $384,750 | |
| Previous Owner | Lamporte Peter S | $32,100 | |
| Previous Owner | Lamporte Peter S | $257,000 |
Source: Public Records
Tax History Compared to Growth
Tax History
| Year | Tax Paid | Tax Assessment Tax Assessment Total Assessment is a certain percentage of the fair market value that is determined by local assessors to be the total taxable value of land and additions on the property. | Land | Improvement |
|---|---|---|---|---|
| 2024 | $2,550 | $473,900 | $130,000 | $343,900 |
| 2023 | $2,544 | $473,900 | $130,000 | $343,900 |
| 2022 | $2,568 | $473,900 | $130,000 | $343,900 |
| 2021 | $2,607 | $473,900 | $130,000 | $343,900 |
| 2020 | $2,261 | $357,500 | $103,600 | $253,900 |
| 2019 | $2,261 | $357,500 | $103,600 | $253,900 |
| 2018 | $2,261 | $357,500 | $103,600 | $253,900 |
| 2017 | $2,315 | $357,500 | $103,600 | $253,900 |
| 2016 | $2,157 | $311,200 | $95,000 | $216,200 |
| 2015 | $2,004 | $311,200 | $95,000 | $216,200 |
| 2014 | $1,970 | $311,200 | $95,000 | $216,200 |
Source: Public Records
Map
Nearby Homes
- 1309 Legacy Ln
- 7941 Grenezay Rd
- 1423 Halcyon Ln
- 1501 Meridian Terrace
- 7907 Reunion Rd
- 1401 Avenel Dr
- 517 Edgewater Club Rd
- 8136 Saltcedar Dr
- 324 Grayhawk Cir
- 8112 Saltcedar Dr
- 1075 Cranford Dr
- 8113 Saltcedar Dr
- 1324 Final Landing Ln
- 8116 Barstow Ln
- 1033 Cranford Dr
- 1025 Cranford Dr
- 8249 Sage Valley Dr
- 8241 Sage Valley Dr
- 8205 Moss Bridge Ct
- 621 Wild Dunes Cir
- 8021 Reunion Rd
- 8029 Reunion Rd
- 8033 Reunion Rd
- 8036 Reunion Rd
- 236 Brockway Rd
- 8015 Reunion Rd
- 8037 Reunion Rd
- 8040 Reunion Rd
- 8041 Reunion Rd
- 8013 Reunion Rd
- 1301 Legacy Ln
- 232 Brockway Rd
- 8044 Reunion Rd
- 8045 Reunion Rd
- 1303 Legacy Ln
- 1305 Legacy Ln
- 8049 Reunion Rd
- 8048 Reunion Rd
- 8053 Reunion Rd
- 8009 Reunion Rd