Estimated Value: $595,000 - $634,000
3
Beds
2
Baths
1,485
Sq Ft
$418/Sq Ft
Est. Value
About This Home
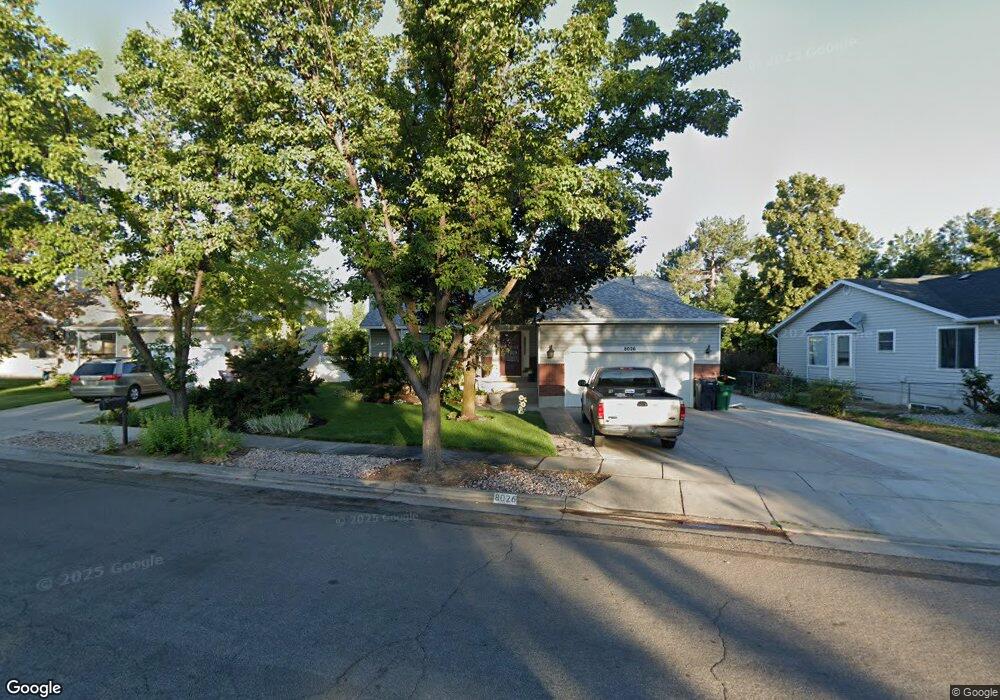
This home is located at 8026 S 865 E, Sandy, UT 84094 and is currently estimated at $621,275, approximately $418 per square foot. 8026 S 865 E is a home located in Salt Lake County with nearby schools including East Sandy School, Union Middle School, and Hillcrest High School.
Ownership History
Date
Name
Owned For
Owner Type
Purchase Details
Closed on
Jul 28, 2021
Sold by
Holm Steven R
Bought by
Holm Steven R and Steven R Holm Revocable Trust
Current Estimated Value
Purchase Details
Closed on
Jan 3, 2006
Sold by
Holm Steven R
Bought by
Holm Steven R
Purchase Details
Closed on
Feb 2, 2004
Sold by
Holm Deborah C
Bought by
Holm Steven R
Purchase Details
Closed on
Nov 20, 1998
Sold by
Holm Steven R
Bought by
Holm Steven R and Holm Deborah C
Create a Home Valuation Report for This Property
The Home Valuation Report is an in-depth analysis detailing your home's value as well as a comparison with similar homes in the area
Home Values in the Area
Average Home Value in this Area
Purchase History
| Date | Buyer | Sale Price | Title Company |
|---|---|---|---|
| Holm Steven R | -- | None Available | |
| Holm Steven R | -- | None Available | |
| Holm Steven R | -- | First American Title | |
| Holm Steven R | -- | -- |
Source: Public Records
Tax History
| Year | Tax Paid | Tax Assessment Tax Assessment Total Assessment is a certain percentage of the fair market value that is determined by local assessors to be the total taxable value of land and additions on the property. | Land | Improvement |
|---|---|---|---|---|
| 2025 | $3,399 | $627,400 | $166,600 | $460,800 |
| 2024 | $3,399 | $627,800 | $160,200 | $467,600 |
| 2023 | $3,350 | $617,200 | $152,200 | $465,000 |
| 2022 | $3,164 | $569,900 | $149,300 | $420,600 |
| 2021 | $2,656 | $406,500 | $116,000 | $290,500 |
| 2020 | $2,561 | $369,800 | $116,000 | $253,800 |
| 2019 | $2,514 | $353,600 | $109,500 | $244,100 |
| 2016 | $2,129 | $288,100 | $109,500 | $178,600 |
Source: Public Records
Map
Nearby Homes
- 760 E 8080 S
- 7899 S 930 E
- 798 E Spruce Tree Ln
- 7819 S Spruce Tree Ln
- 8268 S 865 E
- 8087 S 615 E
- 954 E 7725 S
- 7692 Chad St
- 8390 S 745 E
- 744 E 8425 S
- 7614 S 1000 E
- 8136 S Cottonwood Hills Cir
- 600 E Briarsprings Cir
- 8322 S Levine Ln Unit 111
- 7755 S 1130 E
- 991 Merewood Ct
- 8373 S 1100 E Unit 39
- 7640 S Quail Springs Cir
- 393 E Corral Creek Dr
- 397 E Tractor Dr Unit 103
- 8032 S 865 E
- 7998 S 865 E
- 8042 S 865 E
- 8023 S 830 E
- 8015 S 830 E
- 8031 S 865 E
- 8041 S 865 E
- 8052 S 865 E
- 877 Nighthawk Dr
- 877 E Nighthawk Dr
- 7999 S 830 E
- 8047 S 830 E
- 846 E Cedar Terrace Dr
- 862 E Cedar Terrace Dr
- 846 Cedar Terrace Dr
- 862 Cedar Terrace Dr
- 856 Cedar Terrace Dr
- 8051 S 865 E
- 8030 S Raptor Cove
- 8030 Raptor Cove
Your Personal Tour Guide
Ask me questions while you tour the home.