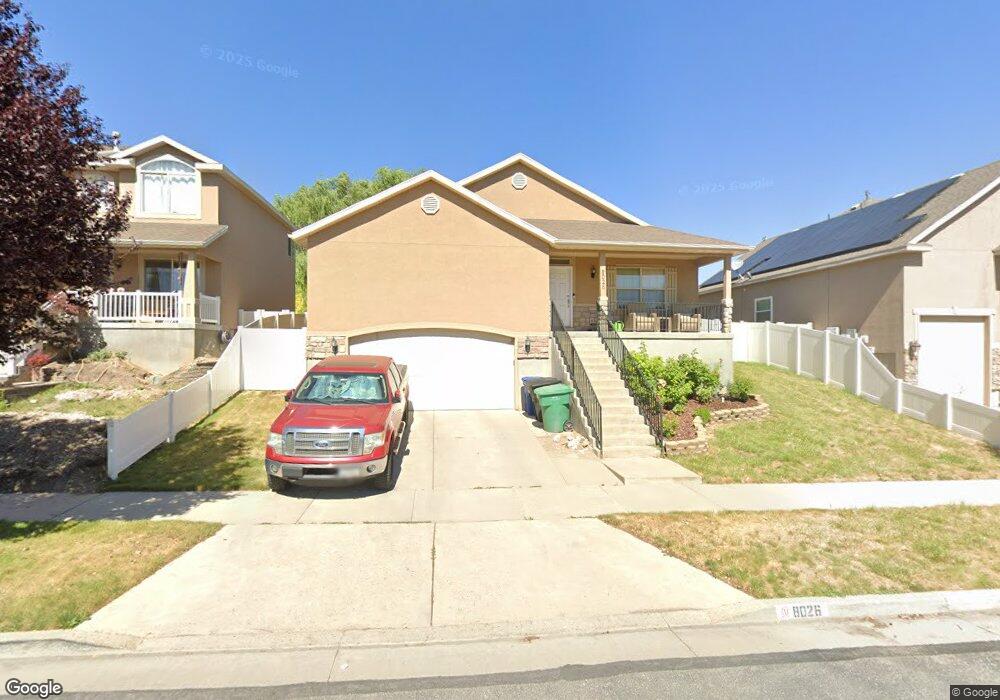
8026 S Bury Rd West Jordan, UT 84081
Jordan Hills NeighborhoodEstimated Value: $566,000 - $590,352
5
Beds
3
Baths
3,102
Sq Ft
$188/Sq Ft
Est. Value
About This Home
This home is located at 8026 S Bury Rd, West Jordan, UT 84081 and is currently estimated at $582,838, approximately $187 per square foot. 8026 S Bury Rd is a home located in Salt Lake County with nearby schools including Sunset Ridge Middle School, Copper Hills High School, and Ascent Academies of Utah West Jordan.
Ownership History
Date
Name
Owned For
Owner Type
Purchase Details
Closed on
Nov 5, 2020
Sold by
Reuland Aaron
Bought by
Reuland Aaron and Jaramillo Gabriela
Current Estimated Value
Purchase Details
Closed on
Aug 12, 2020
Sold by
George Christopher M
Bought by
Reuland Aaron
Home Financials for this Owner
Home Financials are based on the most recent Mortgage that was taken out on this home.
Original Mortgage
$401,149
Outstanding Balance
$355,847
Interest Rate
3%
Mortgage Type
FHA
Estimated Equity
$226,991
Purchase Details
Closed on
Jun 19, 2006
Sold by
Dakota Homes Inc
Bought by
George Christopher M
Home Financials for this Owner
Home Financials are based on the most recent Mortgage that was taken out on this home.
Original Mortgage
$236,000
Interest Rate
6.55%
Mortgage Type
Fannie Mae Freddie Mac
Create a Home Valuation Report for This Property
The Home Valuation Report is an in-depth analysis detailing your home's value as well as a comparison with similar homes in the area
Home Values in the Area
Average Home Value in this Area
Purchase History
| Date | Buyer | Sale Price | Title Company |
|---|---|---|---|
| Reuland Aaron | -- | Accommodation | |
| Reuland Aaron | -- | Eagle Gate Title Ins Agcy | |
| George Christopher M | -- | Meridian Title |
Source: Public Records
Mortgage History
| Date | Status | Borrower | Loan Amount |
|---|---|---|---|
| Open | Reuland Aaron | $401,149 | |
| Previous Owner | George Christopher M | $236,000 |
Source: Public Records
Tax History Compared to Growth
Tax History
| Year | Tax Paid | Tax Assessment Tax Assessment Total Assessment is a certain percentage of the fair market value that is determined by local assessors to be the total taxable value of land and additions on the property. | Land | Improvement |
|---|---|---|---|---|
| 2025 | $2,958 | $588,400 | $109,800 | $478,600 |
| 2024 | $2,958 | $569,200 | $106,100 | $463,100 |
| 2023 | $3,120 | $565,800 | $104,000 | $461,800 |
| 2022 | $3,204 | $571,500 | $102,000 | $469,500 |
| 2021 | $2,581 | $419,200 | $80,900 | $338,300 |
| 2020 | $2,368 | $360,900 | $80,900 | $280,000 |
| 2019 | $2,326 | $347,600 | $80,900 | $266,700 |
| 2018 | $2,167 | $321,200 | $78,500 | $242,700 |
| 2017 | $2,041 | $301,200 | $78,500 | $222,700 |
| 2016 | $1,916 | $265,700 | $78,500 | $187,200 |
| 2015 | $1,848 | $249,800 | $80,000 | $169,800 |
| 2014 | $1,769 | $235,400 | $76,300 | $159,100 |
Source: Public Records
Map
Nearby Homes
- 7011 W Saw Timber Way
- 7953 S 7110 W
- 7009 W 7895 S
- 7069 W Cottage Point Dr
- 7919 S Ares Ct
- 7092 W Jayson Bend Dr
- 7169 Moorepark Place
- Witzel Plan at The Sycamores
- Beatrix Plan at The Sycamores
- Sweetwater Plan at The Sycamores
- Princeton Plan at The Sycamores
- Dakota Plan at The Sycamores
- Dashell Plan at The Sycamores
- Roosevelt Plan at The Sycamores
- Wasatch Plan at The Sycamores
- 7171 W 8170 S
- 7182 Moorepark Place Unit 10
- 7176 Moorepark Place
- 8169 S Flaxton Ln
- 7871 S Fauna Ln