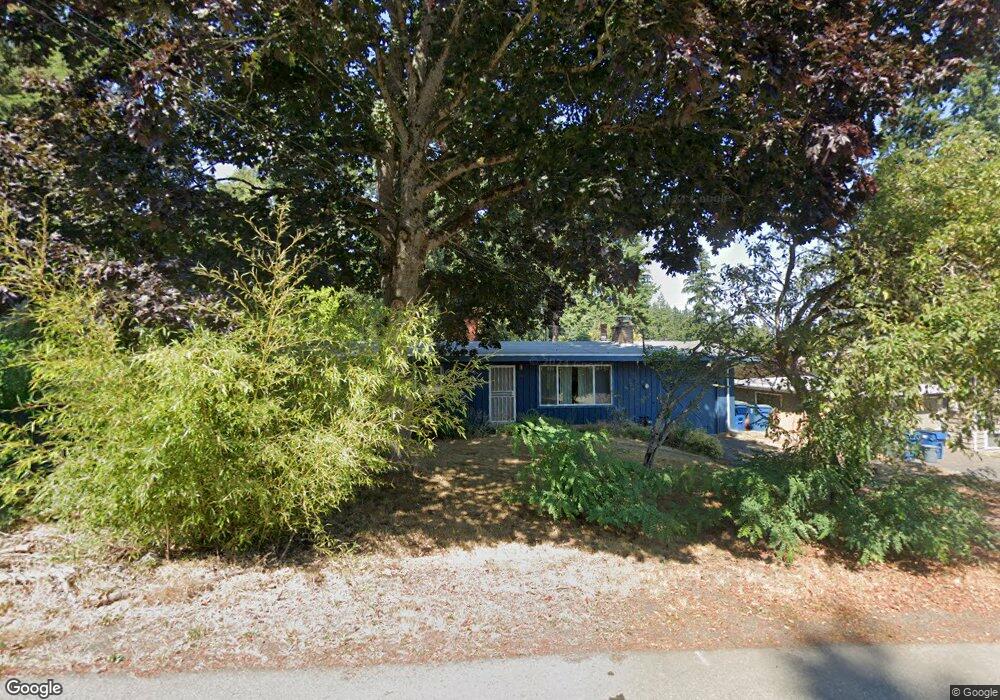
8029 226th St SW Edmonds, WA 98026
Chase Lake NeighborhoodEstimated Value: $721,552 - $780,000
3
Beds
2
Baths
1,130
Sq Ft
$671/Sq Ft
Est. Value
About This Home
This home is located at 8029 226th St SW, Edmonds, WA 98026 and is currently estimated at $758,138, approximately $670 per square foot. 8029 226th St SW is a home located in Snohomish County with nearby schools including Westgate Elementary School, College Place Middle School, and Edmonds-Woodway High School.
Ownership History
Date
Name
Owned For
Owner Type
Purchase Details
Closed on
Feb 13, 2016
Sold by
Kawakami Colin
Bought by
Kawakami Elizabeth Medina
Current Estimated Value
Purchase Details
Closed on
Jul 10, 2000
Sold by
Skeels Daniel L and Creasey Lena L
Bought by
Kawakami Colin H and Kawakami Elizabeth M
Home Financials for this Owner
Home Financials are based on the most recent Mortgage that was taken out on this home.
Original Mortgage
$177,500
Outstanding Balance
$64,954
Interest Rate
8.55%
Estimated Equity
$693,184
Purchase Details
Closed on
Dec 3, 1997
Sold by
Johnson Elmer M and Johnson Ruth M
Bought by
Creasey Lena L and Skeels Dantel L
Home Financials for this Owner
Home Financials are based on the most recent Mortgage that was taken out on this home.
Original Mortgage
$107,950
Interest Rate
6.62%
Create a Home Valuation Report for This Property
The Home Valuation Report is an in-depth analysis detailing your home's value as well as a comparison with similar homes in the area
Home Values in the Area
Average Home Value in this Area
Purchase History
| Date | Buyer | Sale Price | Title Company |
|---|---|---|---|
| Kawakami Elizabeth Medina | -- | None Available | |
| Kawakami Colin H | $197,500 | -- | |
| Creasey Lena L | $119,950 | Fidelity National Title |
Source: Public Records
Mortgage History
| Date | Status | Borrower | Loan Amount |
|---|---|---|---|
| Open | Kawakami Colin H | $177,500 | |
| Previous Owner | Creasey Lena L | $107,950 |
Source: Public Records
Tax History Compared to Growth
Tax History
| Year | Tax Paid | Tax Assessment Tax Assessment Total Assessment is a certain percentage of the fair market value that is determined by local assessors to be the total taxable value of land and additions on the property. | Land | Improvement |
|---|---|---|---|---|
| 2025 | $5,804 | $722,900 | $612,000 | $110,900 |
| 2024 | $5,804 | $699,900 | $589,000 | $110,900 |
| 2023 | $5,796 | $730,100 | $614,000 | $116,100 |
| 2022 | $5,757 | $591,700 | $504,000 | $87,700 |
| 2020 | $5,349 | $483,900 | $396,000 | $87,900 |
| 2019 | $4,995 | $449,400 | $363,000 | $86,400 |
| 2018 | $4,885 | $387,100 | $310,000 | $77,100 |
| 2017 | $4,116 | $337,000 | $269,000 | $68,000 |
| 2016 | $3,700 | $303,400 | $238,000 | $65,400 |
| 2015 | $3,726 | $290,500 | $228,000 | $62,500 |
| 2013 | $2,755 | $202,000 | $147,000 | $55,000 |
Source: Public Records
Map
Nearby Homes
- 22604 78th Ave W
- 8012 222nd St SW
- 7818 228th St SW Unit 106
- 7628 222nd St SW Unit B4
- 23116 80th Place W
- 7923 220th St SW
- 8017 234th St SW Unit 325
- 7317 224th St SW Unit A4
- 7909 218th St SW Unit 4
- 7205 224th St SW Unit M6
- 8825 231st Place SW
- 7522 221st St SW
- 23015 Edmonds Way Unit A103
- 22910 90th Ave W Unit C306
- 23121 Edmonds Way Unit 2
- 8614 Madrona Ln
- 21505 84th Ave W
- 23001 Lakeview Dr Unit I103
- 23727 80th Ct W
- 23227 92nd Ave W
- 8107 226th St SW Unit B
- 8021 226th St SW
- 8029 225th Place SW
- 8115 226th St SW
- 8023 225th Place SW
- 8107 225th Place SW
- 8015 225th Place SW
- 8015 225th ( Lot5) Place SW
- 8009 226th St SW
- 22518 80th Ave W
- 8104 226th St SW
- 8024 226th St SW
- 22502 80th Ave W
- 22502 80th Ave W
- 8011 225th (Lot6) Place SW
- 8011 225th Place SW
- 8111 225th Place SW
- 8020 226th St SW
- 8112 226th St SW
- 22504 80th Ave W