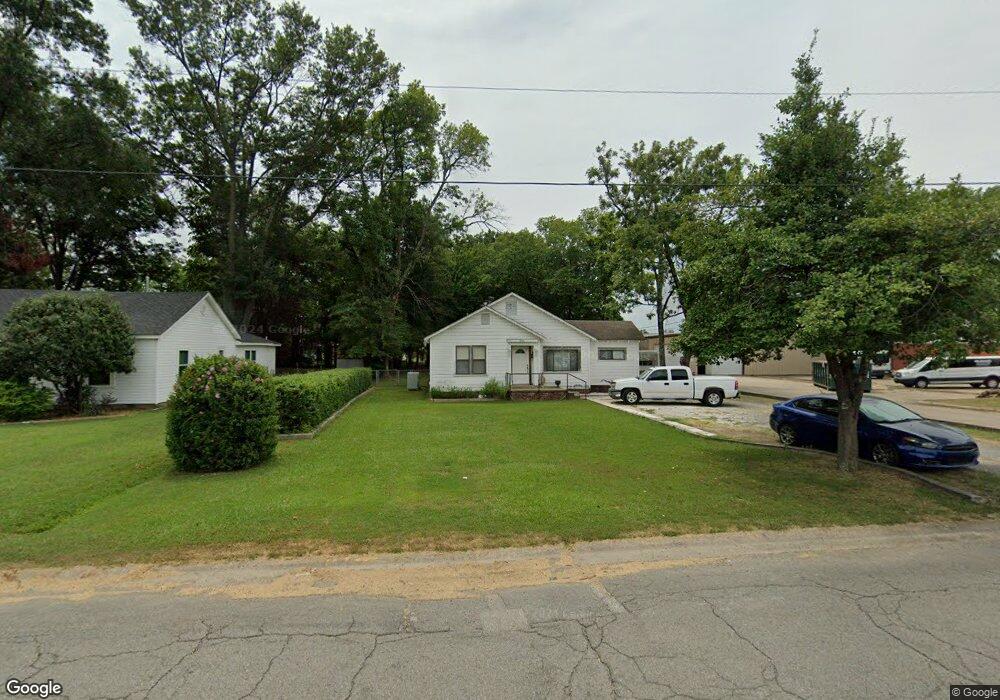
803 2nd St Conway, AR 72032
East Conway NeighborhoodEstimated Value: $118,000 - $149,000
Studio
2
Baths
1,505
Sq Ft
$91/Sq Ft
Est. Value
About This Home
This home is located at 803 2nd St, Conway, AR 72032 and is currently estimated at $136,755, approximately $90 per square foot. 803 2nd St is a home located in Faulkner County with nearby schools including Marguerite Vann Elementary School, Conway Junior High School, and Carl Stuart Middle School.
Ownership History
Date
Name
Owned For
Owner Type
Purchase Details
Closed on
Apr 7, 2021
Sold by
Shofner Greg and Shofner Joan
Bought by
Shofner & Simon Properties Llc
Current Estimated Value
Purchase Details
Closed on
Dec 22, 2017
Sold by
Simon Joseph Gerard and Simon Diana
Bought by
Shofner & Simon Properties Llc
Purchase Details
Closed on
Apr 2, 1997
Bought by
Simon
Create a Home Valuation Report for This Property
The Home Valuation Report is an in-depth analysis detailing your home's value as well as a comparison with similar homes in the area
Home Values in the Area
Average Home Value in this Area
Purchase History
| Date | Buyer | Sale Price | Title Company |
|---|---|---|---|
| Shofner & Simon Properties Llc | -- | None Listed On Document | |
| Shofner & Simon Properties Llc | -- | None Available | |
| Simon | -- | -- |
Source: Public Records
Tax History
| Year | Tax Paid | Tax Assessment Tax Assessment Total Assessment is a certain percentage of the fair market value that is determined by local assessors to be the total taxable value of land and additions on the property. | Land | Improvement |
|---|---|---|---|---|
| 2025 | $831 | $23,600 | $4,500 | $19,100 |
| 2024 | $762 | $23,600 | $4,500 | $19,100 |
| 2023 | $693 | $14,030 | $4,500 | $9,530 |
| 2022 | $640 | $14,030 | $4,500 | $9,530 |
| 2021 | $586 | $14,030 | $4,500 | $9,530 |
| 2020 | $533 | $10,540 | $4,500 | $6,040 |
| 2019 | $533 | $10,540 | $4,500 | $6,040 |
| 2018 | $533 | $10,540 | $4,500 | $6,040 |
| 2017 | $521 | $10,540 | $4,500 | $6,040 |
| 2016 | $477 | $9,430 | $4,500 | $4,930 |
| 2015 | $394 | $12,510 | $4,500 | $8,010 |
| 2014 | $44 | $12,510 | $4,500 | $8,010 |
Source: Public Records
Map
Nearby Homes
- 555 Factory St
- 610 4th St
- 000 Ingram St
- 00 Third Ave
- Oliver-Bradley Unit 6A-6B Bradley Circle
- 1403 Scott St
- 00 Harkrider St
- 1470 College Ave
- 1522 Mill St
- 514 Center St
- 819 & 821 Center St
- 723 3rd Ave
- 303 Oliver St
- 329 Bruce St
- 820 Ash St
- 00 Fourth Ave
- 1621 Prince St
- Lot 21 Conway Blvd
- 575 5th Ave
- 1130 Clifton St
Your Personal Tour Guide
Ask me questions while you tour the home.