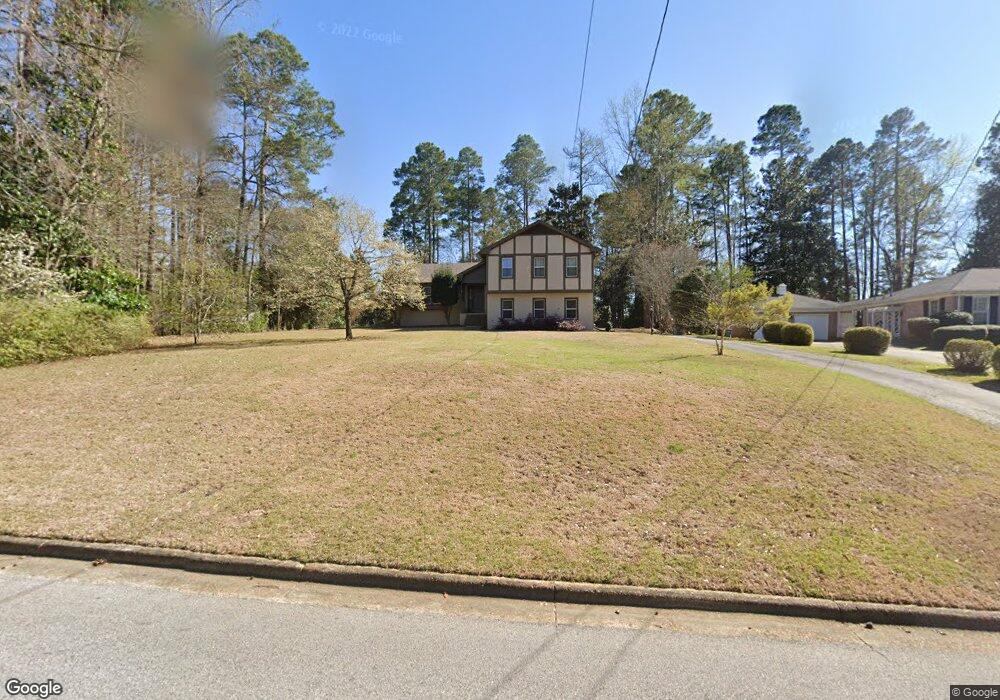
803 Camellia Dr Lagrange, GA 30240
Estimated Value: $267,530 - $444,000
3
Beds
3
Baths
1,570
Sq Ft
$210/Sq Ft
Est. Value
About This Home
This home is located at 803 Camellia Dr, Lagrange, GA 30240 and is currently estimated at $329,633, approximately $209 per square foot. 803 Camellia Dr is a home located in Troup County with nearby schools including Hollis Hand Elementary School, Franklin Forest Elementary School, and Ethel W. Kight Elementary School.
Ownership History
Date
Name
Owned For
Owner Type
Purchase Details
Closed on
Feb 26, 1998
Sold by
Ronald E Holman
Bought by
Cleveland Russell J
Current Estimated Value
Purchase Details
Closed on
Jul 1, 1988
Sold by
Warrick Renee Denise
Bought by
Ronald E Holman
Purchase Details
Closed on
Dec 1, 1984
Sold by
John Paul Warrick
Bought by
Warrick Renee Denise
Purchase Details
Closed on
Jun 18, 1984
Sold by
Margaret A Ayers
Bought by
John Paul Warrick
Purchase Details
Closed on
Apr 30, 1983
Sold by
Dr Wm T and Margaret Ayers
Bought by
Margaret A Ayers
Purchase Details
Closed on
Jun 10, 1978
Sold by
Byrne David M and Byrne Joyce R
Bought by
Dr Wm T and Margaret Ayers
Purchase Details
Closed on
Jan 1, 1972
Sold by
Piney Woods Co
Bought by
Byrne David M and Byrne Joyce R
Create a Home Valuation Report for This Property
The Home Valuation Report is an in-depth analysis detailing your home's value as well as a comparison with similar homes in the area
Purchase History
| Date | Buyer | Sale Price | Title Company |
|---|---|---|---|
| Cleveland Russell J | $137,000 | -- | |
| Ronald E Holman | -- | -- | |
| Warrick Renee Denise | -- | -- | |
| John Paul Warrick | -- | -- | |
| Margaret A Ayers | -- | -- | |
| Dr Wm T | -- | -- | |
| Byrne David M | -- | -- |
Source: Public Records
Tax History
| Year | Tax Paid | Tax Assessment Tax Assessment Total Assessment is a certain percentage of the fair market value that is determined by local assessors to be the total taxable value of land and additions on the property. | Land | Improvement |
|---|---|---|---|---|
| 2025 | $2,327 | $101,360 | $18,000 | $83,360 |
| 2024 | $2,327 | $87,320 | $18,000 | $69,320 |
| 2023 | $2,044 | $76,920 | $18,000 | $58,920 |
| 2022 | $1,984 | $73,080 | $18,000 | $55,080 |
| 2021 | $1,852 | $63,400 | $18,000 | $45,400 |
| 2020 | $1,792 | $61,400 | $16,000 | $45,400 |
| 2019 | $1,795 | $61,520 | $16,000 | $45,520 |
| 2018 | $1,730 | $59,360 | $16,000 | $43,360 |
| 2017 | $1,588 | $54,640 | $16,000 | $38,640 |
| 2016 | $1,599 | $54,986 | $16,000 | $38,986 |
| 2015 | $1,601 | $54,986 | $16,000 | $38,986 |
| 2014 | $1,450 | $49,909 | $16,000 | $33,909 |
| 2013 | -- | $54,323 | $16,000 | $38,323 |
Source: Public Records
Map
Nearby Homes
- 203 S Chilton Crescent
- 201 S Chilton Crescent
- 732 Camellia Dr
- 724 Camellia Dr
- 106 Ewing St
- 116 Wisteria Ridge Terrace
- 102 Beech Creek Dr
- 204 Dixie Creek Dr
- 222 Beechwood Cir
- 204 Colonial St
- 110 Russell St
- 900 North St
- 109 Thomas St
- 806 New Franklin Rd
- 104 Sweetgum Dr
- 705 Piney Woods Dr
- 219 Banks St
- 114 Briarcliff Rd
- 1784 Mooty Bridge Rd
- 120 Saynor Cir
- 303 Ivydale Dr
- 305 Ivydale Dr
- 807 Camellia Dr
- 301 Ivydale Dr
- 802 Camellia Dr
- 804 Camellia Dr
- 729 Camellia Dr
- 806 Wisteria Way
- 802 Wisteria Way
- 800 Camellia Dr
- 806 Camellia Dr
- 299 Ivydale Dr
- 809 Camellia Dr
- 300 Ivydale Dr
- 808 Wisteria Way
- 803 Wisteria Way
- 808 Camellia Dr
- 742 Camellia Dr
- 205 Chesterfield Place
- 727 Camellia Dr
Your Personal Tour Guide
Ask me questions while you tour the home.