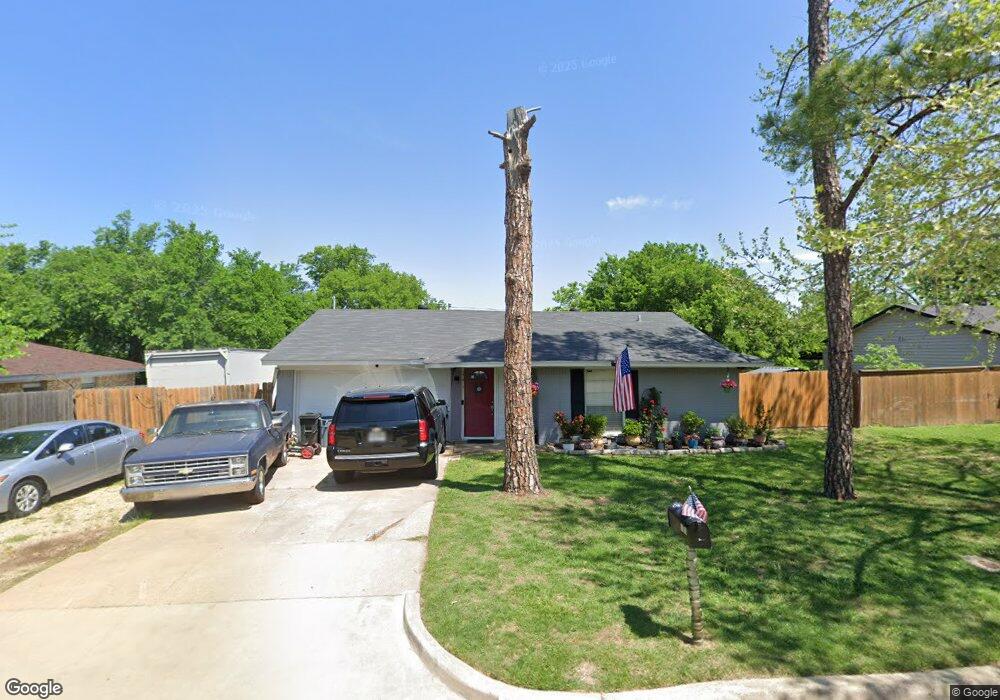
803 Crockett St Midlothian, TX 76065
Estimated Value: $243,999 - $254,000
3
Beds
2
Baths
1,073
Sq Ft
$232/Sq Ft
Est. Value
About This Home
This home is located at 803 Crockett St, Midlothian, TX 76065 and is currently estimated at $249,000, approximately $232 per square foot. 803 Crockett St is a home located in Ellis County with nearby schools including Irvin Elementary School and Frank Seale Middle School.
Ownership History
Date
Name
Owned For
Owner Type
Purchase Details
Closed on
Aug 20, 2019
Sold by
Sahs Timothy B and Sahs Sandra Serna
Bought by
Robles Jose
Current Estimated Value
Home Financials for this Owner
Home Financials are based on the most recent Mortgage that was taken out on this home.
Original Mortgage
$156,289
Outstanding Balance
$136,880
Interest Rate
3.7%
Mortgage Type
VA
Estimated Equity
$112,120
Purchase Details
Closed on
May 7, 2013
Sold by
Hsbc Bank Usa Na
Bought by
Campbell Val
Purchase Details
Closed on
Oct 2, 2012
Sold by
Flower Bryan and Flower Magdalena
Bought by
Hsbc Bank Usa Na
Purchase Details
Closed on
Nov 23, 2005
Sold by
Mentzel Family First5 Pa
Bought by
Flower Brayn
Home Financials for this Owner
Home Financials are based on the most recent Mortgage that was taken out on this home.
Original Mortgage
$69,350
Interest Rate
6.7%
Mortgage Type
Adjustable Rate Mortgage/ARM
Create a Home Valuation Report for This Property
The Home Valuation Report is an in-depth analysis detailing your home's value as well as a comparison with similar homes in the area
Home Values in the Area
Average Home Value in this Area
Purchase History
| Date | Buyer | Sale Price | Title Company |
|---|---|---|---|
| Robles Jose | -- | Providence Title Company | |
| Campbell Val | -- | First American Title Ins Co | |
| Hsbc Bank Usa Na | -- | None Available | |
| Flower Brayn | -- | None Available | |
| Mentzel Family First Partnership | -- | None Available |
Source: Public Records
Mortgage History
| Date | Status | Borrower | Loan Amount |
|---|---|---|---|
| Open | Robles Jose | $156,289 | |
| Previous Owner | Mentzel Family First Partnership | $69,350 |
Source: Public Records
Tax History Compared to Growth
Tax History
| Year | Tax Paid | Tax Assessment Tax Assessment Total Assessment is a certain percentage of the fair market value that is determined by local assessors to be the total taxable value of land and additions on the property. | Land | Improvement |
|---|---|---|---|---|
| 2025 | $4,413 | $222,515 | $90,000 | $132,515 |
| 2024 | $4,413 | $218,705 | $90,000 | $128,705 |
| 2023 | $4,413 | $237,420 | $80,000 | $157,420 |
| 2022 | $4,314 | $192,534 | $60,000 | $132,534 |
| 2021 | $4,185 | $176,870 | $45,000 | $131,870 |
| 2020 | $4,091 | $162,630 | $45,000 | $117,630 |
| 2019 | $3,077 | $117,480 | $0 | $0 |
| 2018 | $2,484 | $117,200 | $20,000 | $97,200 |
| 2017 | $2,953 | $110,940 | $20,000 | $90,940 |
| 2016 | $2,705 | $101,620 | $15,000 | $86,620 |
| 2015 | $1,925 | $73,650 | $15,000 | $58,650 |
| 2014 | $1,925 | $72,310 | $0 | $0 |
Source: Public Records
Map
Nearby Homes
- 807 Crockett St
- 912 Crockett St
- TBD 1 acre Overlook Dr
- 714 Green Acres Ln
- 1105 Crooked Creek Ct
- 620 N 6th St
- 796 N 7th St
- 312 Overlook Dr
- 1834 Rough Ridge Trail
- 0 U S Highway 67
- 000 N 6th St
- 501 N 9th St
- 2281 Key Way
- 1309 Rye Glen Dr
- 810 Bolivar Dr
- 1410 Rye Glen Dr
- 809 Deleon Dr
- 114 S 6th St
- 1401 Yucca St
- TBD Bryant Ave