
Seller's Agent in 2026
Mack Reynolds Jr.
Mack Reynolds Realty, LLC
(706) 302-7374
7 in this area
16 Total Sales
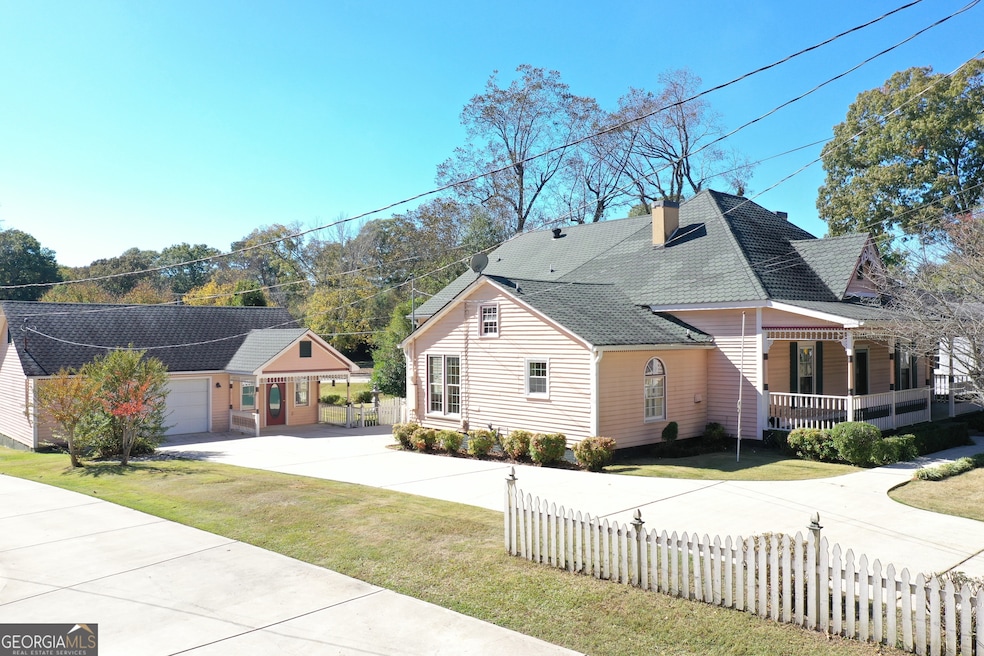
A victorian home built in 1907, renovated in late 1990's, consisting of seven rooms; 3 bedroom 3 full bath, kitchen with breakfast room, dining room, living room, and great room. Beautiful pine flooring, tall ceilings(11 ft.), and large hallway/foyer and bedrooms. Master on Main level with gorgeous stain glass windows. Front porch, back porch and small deck. A 25' by 36' detached victorian style garage and workshop consisting of a 25' by 24' garage and an air conditioned 25' by 12' workshop with cabinetry and staircase leading to an unfinished loft.
Last Agent to Sell the Property
Mack Reynolds Realty, LLC License #324527 Listed on: 11/03/2025
We collect this data history from publicly available records. To have your information removed, we recommend requesting removal directly through your county’s website.
We collect this data history from publicly available records. To have your information removed, we recommend requesting removal directly through your county’s website.
| Date | Type | Sale Price | Title Company |
|---|---|---|---|
| Limited Warranty Deed | $310,000 | -- | |
| Interfamily Deed Transfer | -- | -- | |
| Warranty Deed | $165,000 | -- | |
| Warranty Deed | -- | -- | |
| Warranty Deed | -- | -- | |
| Warranty Deed | $37,000 | -- | |
| Warranty Deed | $23,000 | -- | |
| Warranty Deed | $12,000 | -- | |
| Deed | -- | -- | |
| Deed | -- | -- |
We collect this data history from publicly available records. To have your information removed, we recommend requesting removal directly through your county’s website.
| Date | Status | Loan Amount | Loan Type |
|---|---|---|---|
| Open | $100,000 | Stand Alone Second | |
| Open | $304,385 | FHA |
We collect this data history from publicly available records. To have your information removed, we recommend requesting removal directly through your county’s website.
| Date | Event | Price | List to Sale | Price per Sq Ft |
|---|---|---|---|---|
| 02/06/2026 02/06/26 | Sold | $310,000 | -4.6% | $119 / Sq Ft |
| 12/11/2025 12/11/25 | Pending | -- | -- | -- |
| 11/03/2025 11/03/25 | For Sale | $325,000 | -- | $125 / Sq Ft |
We collect this data history from publicly available records. To have your information removed, we recommend requesting removal directly through your county’s website.
| Year | Tax Paid | Tax Assessment Tax Assessment Total Assessment is a certain percentage of the fair market value that is determined by local assessors to be the total taxable value of land and additions on the property. | Land | Improvement |
|---|---|---|---|---|
| 2025 | $3,164 | $101,760 | $8,000 | $93,760 |
| 2024 | $2,958 | $90,040 | $8,000 | $82,040 |
| 2023 | $2,771 | $84,720 | $8,000 | $76,720 |
| 2022 | $2,673 | $80,560 | $8,000 | $72,560 |
| 2021 | $2,365 | $68,200 | $8,000 | $60,200 |
| 2020 | $2,365 | $68,200 | $8,000 | $60,200 |
| 2019 | $2,347 | $67,720 | $5,600 | $62,120 |
| 2018 | $2,132 | $62,080 | $5,600 | $56,480 |
| 2017 | $2,126 | $61,916 | $5,436 | $56,480 |
| 2016 | $2,074 | $60,546 | $5,436 | $55,110 |
| 2015 | $2,074 | $60,546 | $5,436 | $55,110 |
| 2014 | $1,964 | $57,645 | $5,436 | $52,209 |
| 2013 | -- | $60,297 | $5,436 | $54,861 |
Seller's Agent in 2026
Mack Reynolds Jr.
Mack Reynolds Realty, LLC
(706) 302-7374
7 in this area
16 Total Sales
Buyer's Agent in 2026
Debra Moses
Southern Classic Realtors
(678) 850-0872
7 in this area
114 Total Sales
Source: Georgia MLS
MLS Number: 10636722
APN: 021-3B-006-002
Disclaimer: Certain information contained herein is derived from information provided by parties other than Homes.com. All information provided is deemed reliable, but is not guaranteed to be accurate and should be independently verified.
![]() The data relating to real estate for sale on this web site comes in part from the Broker Reciprocity Program of Georgia MLS. Real estate listings held by brokerage firms other than Redfin are marked with the Broker Reciprocity logo and detailed information about them includes the name of the listing brokers. Information deemed reliable but not guaranteed. Copyright 2026 Georgia MLS. All rights reserved.
The data relating to real estate for sale on this web site comes in part from the Broker Reciprocity Program of Georgia MLS. Real estate listings held by brokerage firms other than Redfin are marked with the Broker Reciprocity logo and detailed information about them includes the name of the listing brokers. Information deemed reliable but not guaranteed. Copyright 2026 Georgia MLS. All rights reserved.
Ask me questions while you tour the home.