Estimated Value: $172,000 - $208,552
4
Beds
1
Bath
1,600
Sq Ft
$122/Sq Ft
Est. Value
About This Home
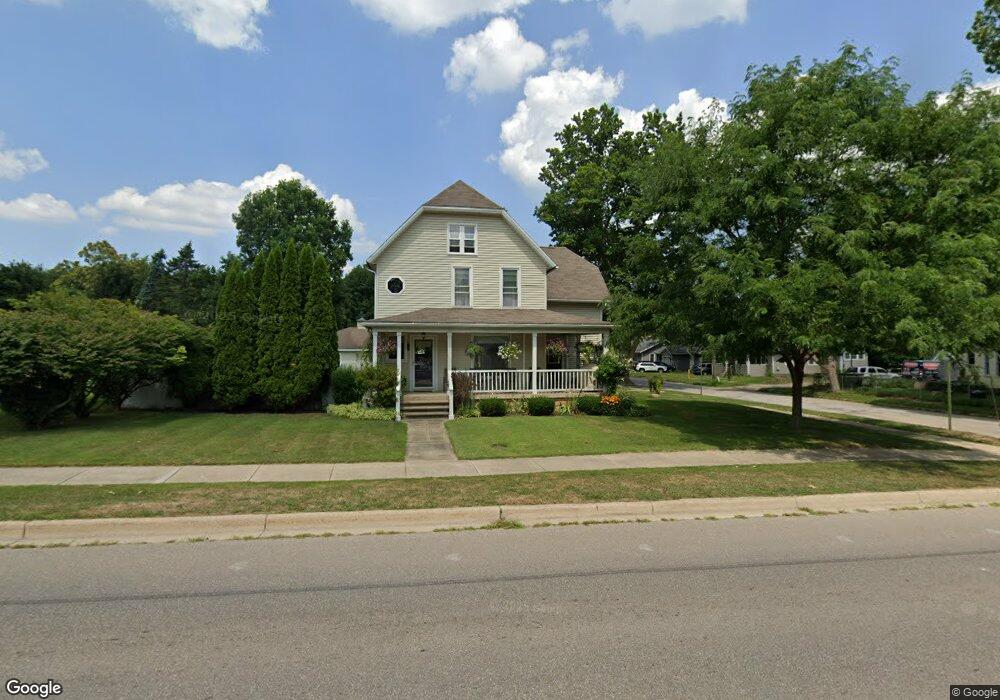
This home is located at 803 Grant St, Niles, MI 49120 and is currently estimated at $195,888, approximately $122 per square foot. 803 Grant St is a home located in Berrien County with nearby schools including Ballard Elementary School, Oak Manor Sixth Grade Center, and Ring Lardner Middle School.
Ownership History
Date
Name
Owned For
Owner Type
Purchase Details
Closed on
Aug 22, 2005
Sold by
Sallak Jeff S
Bought by
Sallak Cheryl L
Current Estimated Value
Purchase Details
Closed on
Oct 21, 1994
Purchase Details
Closed on
Mar 30, 1979
Create a Home Valuation Report for This Property
The Home Valuation Report is an in-depth analysis detailing your home's value as well as a comparison with similar homes in the area
Home Values in the Area
Average Home Value in this Area
Purchase History
| Date | Buyer | Sale Price | Title Company |
|---|---|---|---|
| Sallak Cheryl L | -- | -- | |
| -- | $27,500 | -- | |
| -- | -- | -- |
Source: Public Records
Tax History Compared to Growth
Tax History
| Year | Tax Paid | Tax Assessment Tax Assessment Total Assessment is a certain percentage of the fair market value that is determined by local assessors to be the total taxable value of land and additions on the property. | Land | Improvement |
|---|---|---|---|---|
| 2025 | $1,631 | $85,100 | $0 | $0 |
| 2024 | $1,284 | $79,000 | $0 | $0 |
| 2023 | $1,231 | $67,900 | $0 | $0 |
| 2022 | $1,172 | $65,500 | $0 | $0 |
| 2021 | $1,436 | $55,600 | $6,700 | $48,900 |
| 2020 | $1,421 | $56,500 | $0 | $0 |
| 2019 | $1,403 | $44,200 | $3,100 | $41,100 |
| 2018 | $1,357 | $44,200 | $0 | $0 |
| 2017 | $1,334 | $37,600 | $0 | $0 |
| 2016 | $1,306 | $42,800 | $0 | $0 |
| 2015 | $1,302 | $46,100 | $0 | $0 |
| 2014 | $1,018 | $45,900 | $0 | $0 |
Source: Public Records
Map
Nearby Homes