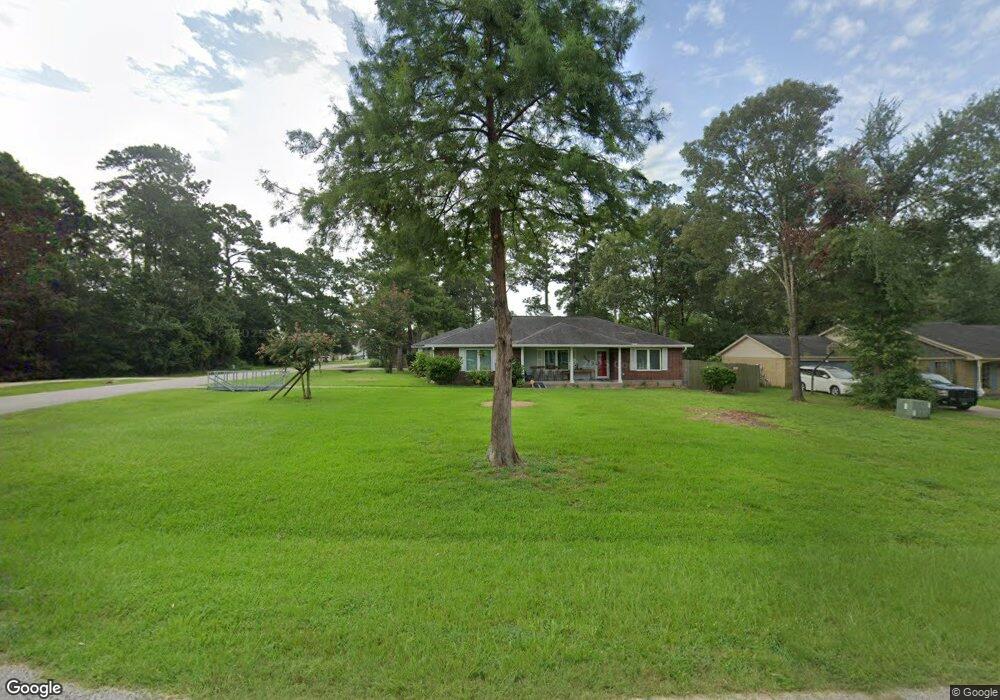
803 Harvey Dr Pinehurst, TX 77362
Pinehurst NeighborhoodEstimated Value: $322,216 - $379,000
3
Beds
2
Baths
1,627
Sq Ft
$214/Sq Ft
Est. Value
About This Home
This home is located at 803 Harvey Dr, Pinehurst, TX 77362 and is currently estimated at $348,804, approximately $214 per square foot. 803 Harvey Dr is a home located in Montgomery County with nearby schools including Decker Prairie Elementary School, Tomball Intermediate School, and Tomball Junior High School.
Ownership History
Date
Name
Owned For
Owner Type
Purchase Details
Closed on
Dec 30, 2005
Sold by
Evans Reuben and Evans Kathleen Q
Bought by
Evans Reuben and Evans Kathleen Q
Current Estimated Value
Purchase Details
Closed on
Jun 2, 2003
Sold by
Word Billy J and Word Norma J
Bought by
Evans Reuben and Boggess Kathleen Q
Home Financials for this Owner
Home Financials are based on the most recent Mortgage that was taken out on this home.
Original Mortgage
$106,500
Outstanding Balance
$46,517
Interest Rate
5.74%
Mortgage Type
Purchase Money Mortgage
Estimated Equity
$302,287
Purchase Details
Closed on
Apr 10, 2003
Sold by
Word Billy J and Word Norma J
Bought by
Evans Reuben
Home Financials for this Owner
Home Financials are based on the most recent Mortgage that was taken out on this home.
Original Mortgage
$106,500
Outstanding Balance
$46,517
Interest Rate
5.74%
Mortgage Type
Purchase Money Mortgage
Estimated Equity
$302,287
Purchase Details
Closed on
Jul 15, 1992
Sold by
Washington Helen
Bought by
Evans Rueben and Evans Kathleen Q
Purchase Details
Closed on
Aug 28, 1990
Sold by
Washington Danny Darryl
Bought by
Evans Rueben and Evans Kathleen Q
Create a Home Valuation Report for This Property
The Home Valuation Report is an in-depth analysis detailing your home's value as well as a comparison with similar homes in the area
Home Values in the Area
Average Home Value in this Area
Purchase History
| Date | Buyer | Sale Price | Title Company |
|---|---|---|---|
| Evans Reuben | -- | None Available | |
| Evans Reuben | -- | Alamo Title Company | |
| Evans Reuben | -- | Alamo Title Company | |
| Evans Rueben | -- | -- | |
| Evans Rueben | -- | -- |
Source: Public Records
Mortgage History
| Date | Status | Borrower | Loan Amount |
|---|---|---|---|
| Open | Evans Reuben | $106,500 | |
| Previous Owner | Evans Reuben | $106,500 |
Source: Public Records
Tax History Compared to Growth
Tax History
| Year | Tax Paid | Tax Assessment Tax Assessment Total Assessment is a certain percentage of the fair market value that is determined by local assessors to be the total taxable value of land and additions on the property. | Land | Improvement |
|---|---|---|---|---|
| 2025 | $1,442 | $285,471 | $58,696 | $226,775 |
| 2024 | $1,328 | $274,835 | -- | -- |
| 2023 | $1,328 | $249,850 | $58,700 | $204,810 |
| 2022 | $4,196 | $227,140 | $59,210 | $190,640 |
| 2021 | $3,968 | $206,490 | $40,560 | $165,930 |
| 2020 | $4,250 | $212,050 | $40,560 | $171,490 |
| 2019 | $4,106 | $207,980 | $40,560 | $170,990 |
| 2018 | $2,723 | $189,070 | $14,380 | $176,260 |
| 2017 | $3,577 | $171,880 | $14,380 | $157,500 |
| 2016 | $3,578 | $171,940 | $14,380 | $164,830 |
| 2015 | $2,671 | $156,310 | $14,380 | $141,930 |
| 2014 | $2,671 | $147,600 | $14,380 | $133,220 |
Source: Public Records
Map
Nearby Homes
- 622 Platinum Stone Ln
- 922 Kip Ln
- 1015 Ginger Glade Ln
- 514 Pearl View Ln
- 2008 Green Terrace Ln
- 1026 Pleasant Pines Ln
- 00 W Rollingwood St
- 1005 Ivy Meadow Ln
- 34427 Spring Creek Cir
- 1004 Ivy Meadow Ln
- 1219 Coe Rd
- 2831 Goodson Loop
- 222 Reynosa Ct
- 330 Mill Creek Rd
- 1046 Goodson Loop Unit 1
- 207 Fox Squirrel Ct
- 1426 Northwood Bluff Ln
- 669 Platinum Stone Ln
- 1439 Northwood Bluff Ln
- 33931 Mill Creek Way
- 807 Harvey Dr
- 4639 Mesquite Blush
- 4620 Mesquite Blush
- 4619 Mesquite Blush
- 34605 Bernice Dr
- 811 Harvey Dr
- 0 Harvey Ln
- 806 Harvey Dr
- 802 Harvey Dr
- 810 Harvey Dr
- 810 Kip Ln
- 814 Harvey Dr
- 614 Platinum Stone Ln
- 682 Platinum Stone Ln
- 610 Platinum Stone Ln
- 690 Platinum Stone Ln
- 698 Platinum Stone Ln
- 670 Platinum Stone Ln
- 676 Platinum Stone Ln
- 626 Platinum Stone Ln