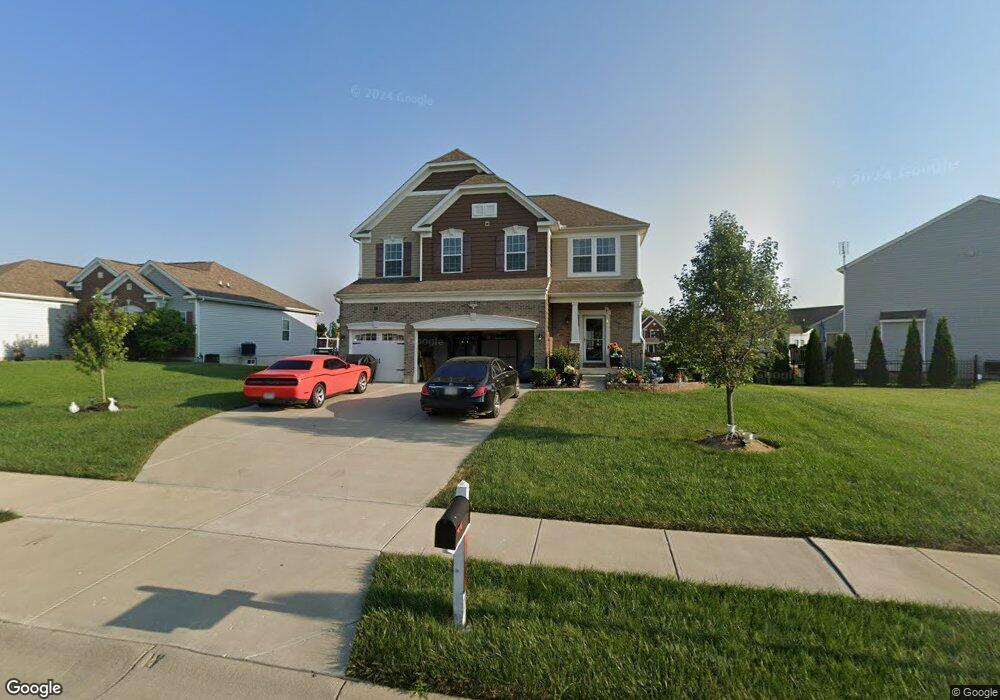
803 Hocking Meadow Cir Monroe, OH 45050
Estimated Value: $397,000 - $517,000
5
Beds
4
Baths
4,349
Sq Ft
$111/Sq Ft
Est. Value
About This Home
This home is located at 803 Hocking Meadow Cir, Monroe, OH 45050 and is currently estimated at $482,106, approximately $110 per square foot. 803 Hocking Meadow Cir is a home located in Butler County with nearby schools including Monroe Primary School, Monroe Elementary School, and Monroe Junior High School.
Ownership History
Date
Name
Owned For
Owner Type
Purchase Details
Closed on
Jun 7, 2021
Sold by
Kaur Surpincler and Singh Parminder
Bought by
Singh Kulwant
Current Estimated Value
Home Financials for this Owner
Home Financials are based on the most recent Mortgage that was taken out on this home.
Original Mortgage
$297,500
Outstanding Balance
$267,583
Interest Rate
2.9%
Mortgage Type
New Conventional
Estimated Equity
$214,523
Purchase Details
Closed on
Sep 23, 2019
Sold by
Singh Parminder and Kaur Paramjeet
Bought by
Kaur Surpinder
Purchase Details
Closed on
Mar 20, 2018
Sold by
Maronda Homes Inc
Bought by
Singh Parminder and Kaur Paramjeet
Home Financials for this Owner
Home Financials are based on the most recent Mortgage that was taken out on this home.
Original Mortgage
$182,000
Interest Rate
4.32%
Mortgage Type
New Conventional
Create a Home Valuation Report for This Property
The Home Valuation Report is an in-depth analysis detailing your home's value as well as a comparison with similar homes in the area
Home Values in the Area
Average Home Value in this Area
Purchase History
| Date | Buyer | Sale Price | Title Company |
|---|---|---|---|
| Singh Kulwant | $350,000 | None Available | |
| Kaur Surpinder | $350,000 | None Available | |
| Singh Parminder | $357,205 | None Available |
Source: Public Records
Mortgage History
| Date | Status | Borrower | Loan Amount |
|---|---|---|---|
| Open | Singh Kulwant | $297,500 | |
| Previous Owner | Singh Parminder | $182,000 |
Source: Public Records
Tax History
| Year | Tax Paid | Tax Assessment Tax Assessment Total Assessment is a certain percentage of the fair market value that is determined by local assessors to be the total taxable value of land and additions on the property. | Land | Improvement |
|---|---|---|---|---|
| 2025 | $8,194 | $1,120 | $1,120 | -- |
| 2024 | $8,194 | $181,930 | $14,620 | $167,310 |
| 2023 | $8,140 | $182,450 | $14,620 | $167,830 |
| 2022 | $5,859 | $115,380 | $14,620 | $100,760 |
| 2021 | $5,807 | $115,380 | $14,620 | $100,760 |
| 2020 | $6,015 | $115,380 | $14,620 | $100,760 |
| 2019 | $6,348 | $92,580 | $15,210 | $77,370 |
| 2018 | $2,822 | $50,150 | $15,210 | $34,940 |
| 2017 | $568 | $9,890 | $9,890 | $0 |
Source: Public Records
Map
Nearby Homes
- 856 Hocking Meadow Cir
- 852 Willowbrook Dr
- 850 Sands Ave
- 220 Gatehouse Ct
- 115 Meeker Ln
- 32 W Elm St
- 1753 Weatherstone Cir Unit 13G6
- 160 Gorman Ct
- 921 Heritage Green Dr Unit 9302
- 1416 Wilderness Way Unit 7300
- 100 N Main St
- 5019 Yankee Rd
- 180 Wexford Dr
- 965 Rustic Ct
- 75 Teil Tree Ct
- 132 Village Ct
- 6893 Gaspar Trail
- 6935 Gaspar Trail
- 415 Brookhurst Dr
- 125 Dobbin Ct
- 805 Hocking Meadow Cir
- 801 Hocking Meadow Cir
- 854 Hocking Meadow Cir
- 852 Hocking Meadow Cir
- 876 Hocking Meadow Cir
- 874 Hocking Meadow Cir
- 850 Hocking Meadow Cir Unit 5934
- 850 Hocking Meadow Cir
- 747 Wyandot Woods Blvd
- 809 Hocking Meadow Cir
- 872 Hocking Meadow Cir
- 848 Hocking Meadow Cir
- 848 Hocking Meadow Cir Unit 5922
- 868 Hocking Meadow Cir
- 866 Hocking Meadow Cir
- 741 Wyandot Woods Blvd
- 811 Hocking Meadow Cir
- 870 Hocking Meadow Cir Unit 5943
- 864 Hocking Meadow Cir
- 855 Hocking Meadow Cir
Your Personal Tour Guide
Ask me questions while you tour the home.