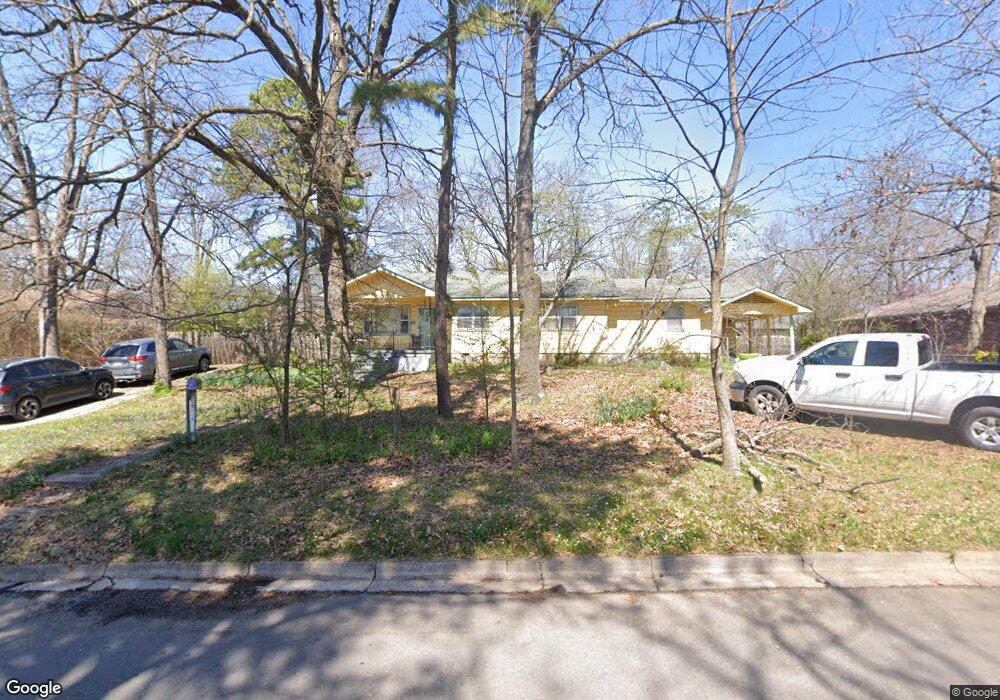
803 Janet St Tahlequah, OK 74464
Estimated Value: $187,916 - $236,000
3
Beds
2
Baths
1,880
Sq Ft
$115/Sq Ft
Est. Value
About This Home
This home is located at 803 Janet St, Tahlequah, OK 74464 and is currently estimated at $216,979, approximately $115 per square foot. 803 Janet St is a home located in Cherokee County with nearby schools including Cherokee Elementary School, Greenwood Elementary School, and Tahlequah Middle School.
Ownership History
Date
Name
Owned For
Owner Type
Purchase Details
Closed on
Aug 28, 2013
Sold by
Hatami Manoochehr and Mazahery Afsaneh K
Bought by
Littlejohn Timothy and Littlejohn Susan
Current Estimated Value
Purchase Details
Closed on
Sep 21, 2011
Sold by
Fulk George W and Fulk Mary A
Bought by
Scott Wesley D
Home Financials for this Owner
Home Financials are based on the most recent Mortgage that was taken out on this home.
Original Mortgage
$116,500
Interest Rate
4.34%
Mortgage Type
New Conventional
Purchase Details
Closed on
Feb 13, 2009
Sold by
Fulk George W and Fulk Mary A
Bought by
Fulk Mary A and Fulk George W
Home Financials for this Owner
Home Financials are based on the most recent Mortgage that was taken out on this home.
Original Mortgage
$43,522
Interest Rate
4.91%
Mortgage Type
Purchase Money Mortgage
Purchase Details
Closed on
Jun 9, 2008
Sold by
Hatami Manoochehr
Bought by
Hatami Manoocher
Create a Home Valuation Report for This Property
The Home Valuation Report is an in-depth analysis detailing your home's value as well as a comparison with similar homes in the area
Home Values in the Area
Average Home Value in this Area
Purchase History
| Date | Buyer | Sale Price | Title Company |
|---|---|---|---|
| Littlejohn Timothy | -- | None Available | |
| Scott Wesley D | $107,000 | None Available | |
| Fulk Mary A | $43,000 | None Available | |
| Hatami Manoocher | $148 | None Available |
Source: Public Records
Mortgage History
| Date | Status | Borrower | Loan Amount |
|---|---|---|---|
| Previous Owner | Scott Wesley D | $116,500 | |
| Previous Owner | Fulk Mary A | $43,522 |
Source: Public Records
Tax History Compared to Growth
Tax History
| Year | Tax Paid | Tax Assessment Tax Assessment Total Assessment is a certain percentage of the fair market value that is determined by local assessors to be the total taxable value of land and additions on the property. | Land | Improvement |
|---|---|---|---|---|
| 2025 | $955 | $9,802 | $1,309 | $8,493 |
| 2024 | $955 | $10,076 | $1,309 | $8,767 |
| 2023 | $955 | $13,813 | $1,299 | $12,514 |
| 2022 | $1,282 | $13,813 | $1,299 | $12,514 |
| 2021 | $1,286 | $13,813 | $1,299 | $12,514 |
| 2020 | $1,264 | $13,331 | $1,299 | $12,032 |
| 2019 | $1,193 | $12,696 | $1,299 | $11,397 |
| 2018 | $1,149 | $12,092 | $1,299 | $10,793 |
| 2017 | $1,147 | $12,092 | $1,299 | $10,793 |
| 2016 | $1,115 | $11,679 | $1,299 | $10,380 |
| 2015 | $1,108 | $11,122 | $1,299 | $9,823 |
| 2014 | $1,108 | $11,770 | $990 | $10,780 |
Source: Public Records
Map
Nearby Homes
- 802 E Seneca St
- 920 Francis Ave
- 425 E Seneca St
- 707 Victor St
- 710 Victor St
- 717 N Oklahoma Ave
- 640 N Oklahoma Ave
- 112 W Allen Rd
- 1450 E Allen Rd
- 605 E Ward St
- 609 E Ward St
- 1505 E Summerfield St
- 407 N Bliss Ave
- 2020 N Everly Dr
- 2021 N Everly Dr
- 2000 N Everly Dr
- 1930 N Everly Dr
- 2010 N Everly Dr
- 2030 N Everly Dr
- 2031 N Everly Dr