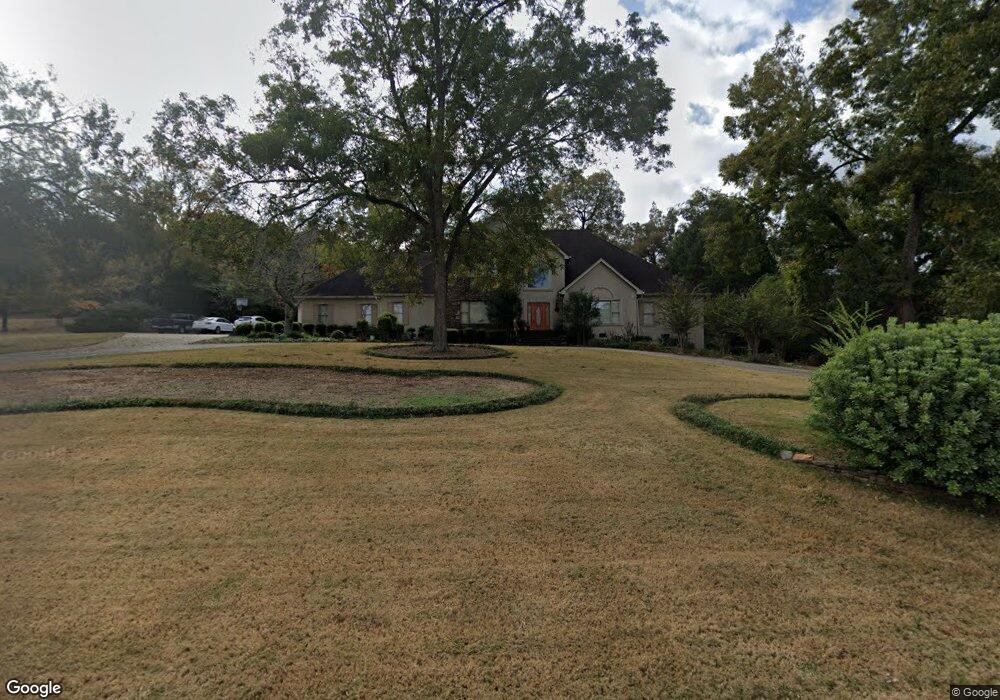
803 Lennox Dr SE Conyers, GA 30094
Estimated Value: $528,146 - $777,000
3
Beds
4
Baths
4,902
Sq Ft
$129/Sq Ft
Est. Value
About This Home
This home is located at 803 Lennox Dr SE, Conyers, GA 30094 and is currently estimated at $632,037, approximately $128 per square foot. 803 Lennox Dr SE is a home located in Rockdale County with nearby schools including Flat Shoals Elementary School, Edwards Middle School, and Salem High School.
Ownership History
Date
Name
Owned For
Owner Type
Purchase Details
Closed on
Oct 8, 2008
Sold by
Bridges Rozetta J
Bought by
Bridges Major E and Bridges Rozetta J
Current Estimated Value
Purchase Details
Closed on
Oct 12, 2007
Sold by
Langston Martha L
Bought by
Bridges Rozetta J
Home Financials for this Owner
Home Financials are based on the most recent Mortgage that was taken out on this home.
Original Mortgage
$417,000
Interest Rate
7.88%
Mortgage Type
New Conventional
Purchase Details
Closed on
Jan 13, 1999
Sold by
Jones Jacquelyn Elaine
Bought by
Langston Jr Alonza and Langston Jr Sm-Etal
Home Financials for this Owner
Home Financials are based on the most recent Mortgage that was taken out on this home.
Original Mortgage
$300,000
Interest Rate
6.84%
Mortgage Type
New Conventional
Create a Home Valuation Report for This Property
The Home Valuation Report is an in-depth analysis detailing your home's value as well as a comparison with similar homes in the area
Home Values in the Area
Average Home Value in this Area
Purchase History
| Date | Buyer | Sale Price | Title Company |
|---|---|---|---|
| Bridges Major E | -- | -- | |
| Bridges Rozetta J | $469,000 | -- | |
| Langston Jr Alonza | $375,000 | -- |
Source: Public Records
Mortgage History
| Date | Status | Borrower | Loan Amount |
|---|---|---|---|
| Previous Owner | Bridges Rozetta J | $417,000 | |
| Previous Owner | Langston Jr Alonza | $300,000 |
Source: Public Records
Tax History Compared to Growth
Tax History
| Year | Tax Paid | Tax Assessment Tax Assessment Total Assessment is a certain percentage of the fair market value that is determined by local assessors to be the total taxable value of land and additions on the property. | Land | Improvement |
|---|---|---|---|---|
| 2024 | $4,118 | $189,080 | $26,000 | $163,080 |
| 2023 | $3,229 | $161,960 | $26,000 | $135,960 |
| 2022 | $2,540 | $122,880 | $26,000 | $96,880 |
| 2021 | $2,715 | $122,880 | $26,000 | $96,880 |
| 2020 | $2,822 | $122,880 | $26,000 | $96,880 |
| 2019 | $2,716 | $116,880 | $20,000 | $96,880 |
| 2018 | $2,652 | $114,280 | $20,000 | $94,280 |
| 2017 | $2,471 | $107,440 | $20,000 | $87,440 |
| 2016 | $2,247 | $107,440 | $20,000 | $87,440 |
| 2015 | $2,247 | $107,440 | $20,000 | $87,440 |
| 2014 | $1,949 | $107,440 | $20,000 | $87,440 |
| 2013 | -- | $142,040 | $30,000 | $112,040 |
Source: Public Records
Map
Nearby Homes
- 2464 Lennox Rd SE
- 784 Stieff Ct SE
- 2608 Downing Park Dr SE
- Boston Plan at Millers Pointe
- Atlanta Plan at Millers Pointe
- Columbus Plan at Millers Pointe
- 2537 Lennox Rd SE
- 2197 Boxwood Cir
- 1920 Logan Ln
- 2474 Harvest Dr SE
- 1420 Hillside Place SE
- 1019 Henna Ct SE
- 1135 Vineyard Dr SE
- 2684 Harvest Dr SE
- Astrid Plan at Alder Park
- Harrison Plan at Alder Park
- Baker Plan at Alder Park
- Oliver Plan at Alder Park
- 1511 Hillside Dr SE
- 1508 Hillside Dr SE
- 793 Lennox Dr SE
- 813 Lennox Dr SE
- 785 Stieff Ct SE
- 783 Stieff Ct SE
- 787 Stieff Ct SE Unit 27
- 787 Stieff Ct SE
- 823 Lennox Dr SE
- 781 Stieff Ct SE
- 2459 Lennox Rd SE
- 2464 Lennox Rd SE Unit 9
- 2502 Lennox Rd SE
- 784 Stieff Ct SE Unit 25
- 782 Stieff Ct SE
- 786 Stieff Ct SE Unit 26
- 786 Stieff Ct SE
- 0 Lennox Dr SE Unit 8465988
- 0 Lennox Rd SE Unit 7628160
- 0 Lennox Rd SE Unit 8806397
- 2504 Lennox Rd SE Unit 2
- 2387 Lost Valley Trail SE