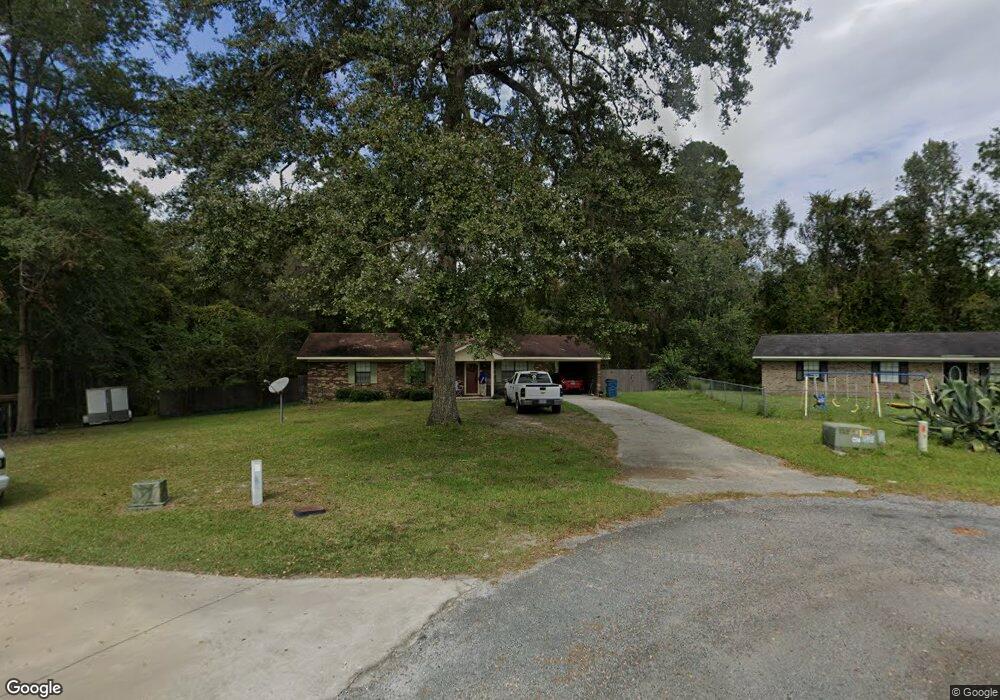
803 Live Oak Ln Waycross, GA 31503
Estimated Value: $146,659 - $201,000
3
Beds
1
Bath
1,200
Sq Ft
$140/Sq Ft
Est. Value
About This Home
This home is located at 803 Live Oak Ln, Waycross, GA 31503 and is currently estimated at $168,165, approximately $140 per square foot. 803 Live Oak Ln is a home located in Brantley County with nearby schools including Hoboken Elementary School, Brantley County Middle School, and Brantley County High School.
Ownership History
Date
Name
Owned For
Owner Type
Purchase Details
Closed on
Mar 12, 2021
Sold by
Rittenhouse Kevin
Bought by
Morgan Joshua Phillip
Current Estimated Value
Home Financials for this Owner
Home Financials are based on the most recent Mortgage that was taken out on this home.
Original Mortgage
$106,868
Outstanding Balance
$95,848
Interest Rate
2.73%
Mortgage Type
New Conventional
Estimated Equity
$72,317
Purchase Details
Closed on
Nov 10, 2017
Sold by
Jarrard Nicky L
Bought by
Rittenhouse Kevin
Home Financials for this Owner
Home Financials are based on the most recent Mortgage that was taken out on this home.
Original Mortgage
$78,452
Interest Rate
3.91%
Mortgage Type
FHA
Purchase Details
Closed on
Feb 10, 2006
Sold by
Tyre James Dale
Bought by
Jarrard Nicky L
Home Financials for this Owner
Home Financials are based on the most recent Mortgage that was taken out on this home.
Original Mortgage
$62,830
Interest Rate
6.08%
Mortgage Type
New Conventional
Create a Home Valuation Report for This Property
The Home Valuation Report is an in-depth analysis detailing your home's value as well as a comparison with similar homes in the area
Home Values in the Area
Average Home Value in this Area
Purchase History
| Date | Buyer | Sale Price | Title Company |
|---|---|---|---|
| Morgan Joshua Phillip | $105,000 | -- | |
| Rittenhouse Kevin | $79,900 | -- | |
| Jarrard Nicky L | $62,830 | -- |
Source: Public Records
Mortgage History
| Date | Status | Borrower | Loan Amount |
|---|---|---|---|
| Open | Morgan Joshua Phillip | $106,868 | |
| Previous Owner | Rittenhouse Kevin | $78,452 | |
| Previous Owner | Jarrard Nicky L | $62,830 |
Source: Public Records
Tax History Compared to Growth
Tax History
| Year | Tax Paid | Tax Assessment Tax Assessment Total Assessment is a certain percentage of the fair market value that is determined by local assessors to be the total taxable value of land and additions on the property. | Land | Improvement |
|---|---|---|---|---|
| 2024 | $1,443 | $37,438 | $2,400 | $35,038 |
| 2023 | $1,447 | $37,438 | $2,400 | $35,038 |
| 2022 | $1,411 | $36,238 | $2,400 | $33,838 |
| 2021 | $1,042 | $24,031 | $2,400 | $21,631 |
| 2020 | $1,068 | $24,031 | $2,400 | $21,631 |
| 2019 | $1,067 | $24,031 | $2,400 | $21,631 |
| 2018 | $814 | $24,031 | $2,400 | $21,631 |
| 2017 | $814 | $24,031 | $2,400 | $21,631 |
| 2016 | $1,098 | $24,031 | $2,400 | $21,631 |
| 2015 | -- | $24,031 | $2,400 | $21,631 |
Source: Public Records
Map
Nearby Homes
- 56 Fj Melton Ln
- 157 Hwy
- 563 Bennett Rd
- 7532 Central Ave
- 7312 Blue Lake Cir
- 12091 Central Ave
- 12169 Central Ave
- 115 Travis Trail
- 0 Miles Still Rd
- 5588 Brunswick Hwy
- 4003 Harvard Ave
- 6932 Greenfield Rd
- 6934 Greenfield Rd
- 6930 Greenfield Rd
- 6935 Greenfield Rd
- 6929 Greenfield Rd
- 6927 Greenfield Rd
- 4003 Oxford Ln
- 57 Lynn Holly Ln
- 26 Lynn Holly Ln
- 809 Live Oak Ln
- 31 Live Oak Ln
- 8 Live Oak Ln
- 26 Live Oak Ln
- 312 Whispering Pines Trail
- 279 Whispering Pines Trail
- 279 Whispering Pines Trail
- 355 Whispering Pines Trail
- 262 Whispering Pines Trail
- 352 Whispering Pines Trail
- 259 Whispering Pines Trail
- 222 Whispering Pines Trail
- 222 Whispering Pines Trail
- 0 Whispering Pines Trail
- 251 Whispering Pines Trail
- 380 Whispering Pines Trail
- 196 Whispering Pines Trail
- 427 Whispering Pines Trail
- 184 Whispering Pines Trail
- 65 Roberson Way