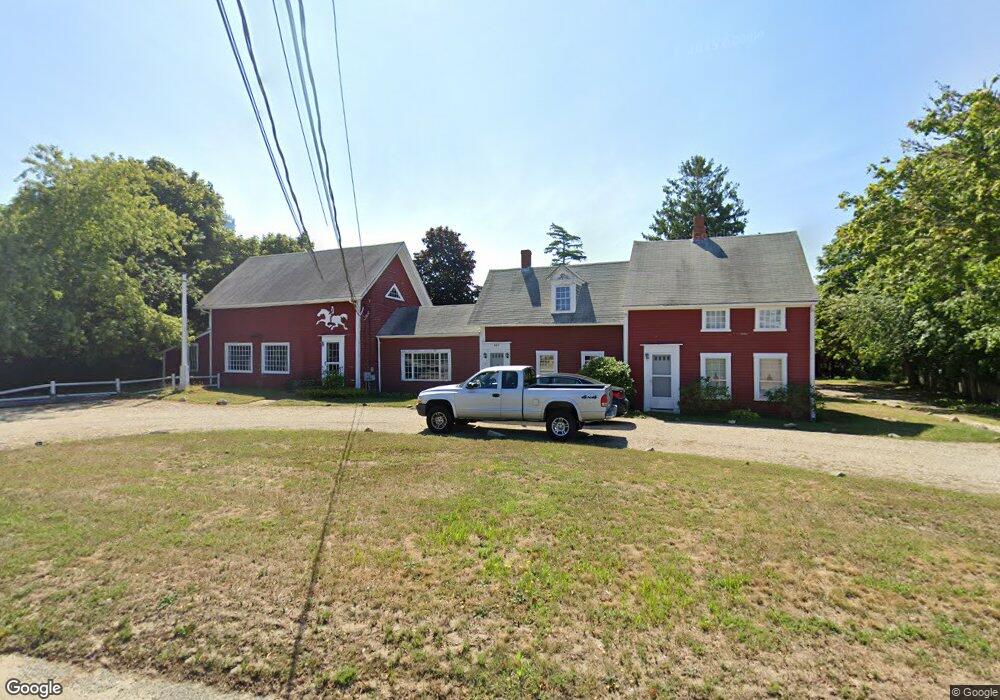
803 Main St West Dennis, MA 02670
West Dennis NeighborhoodEstimated Value: $734,968
5
Beds
4
Baths
3,508
Sq Ft
$210/Sq Ft
Est. Value
About This Home
This home is located at 803 Main St, West Dennis, MA 02670 and is currently estimated at $734,968, approximately $209 per square foot. 803 Main St is a home located in Barnstable County with nearby schools including Dennis-Yarmouth Regional High School and St. Pius X. School.
Ownership History
Date
Name
Owned For
Owner Type
Purchase Details
Closed on
Dec 8, 2006
Sold by
Walker Rt
Bought by
Ponderosa Rt
Current Estimated Value
Purchase Details
Closed on
Mar 1, 2006
Sold by
Walker Rt
Bought by
Mccrossin Kimberly L
Home Financials for this Owner
Home Financials are based on the most recent Mortgage that was taken out on this home.
Original Mortgage
$285,000
Interest Rate
6.16%
Mortgage Type
Commercial
Purchase Details
Closed on
Aug 6, 2001
Sold by
Callahan John T
Bought by
Walker Rt
Home Financials for this Owner
Home Financials are based on the most recent Mortgage that was taken out on this home.
Original Mortgage
$110,000
Interest Rate
7.14%
Mortgage Type
Commercial
Purchase Details
Closed on
May 22, 1998
Sold by
Durgin Emma M Est
Bought by
Callahan John T
Purchase Details
Closed on
Oct 9, 1991
Sold by
Nickerson Caleb G
Bought by
Callahan John T
Create a Home Valuation Report for This Property
The Home Valuation Report is an in-depth analysis detailing your home's value as well as a comparison with similar homes in the area
Home Values in the Area
Average Home Value in this Area
Purchase History
| Date | Buyer | Sale Price | Title Company |
|---|---|---|---|
| Ponderosa Rt | -- | -- | |
| Mccrossin Kimberly L | $385,000 | -- | |
| Walker Rt | $145,000 | -- | |
| Callahan John T | $137,600 | -- | |
| Callahan John T | $2,500 | -- |
Source: Public Records
Mortgage History
| Date | Status | Borrower | Loan Amount |
|---|---|---|---|
| Open | Callahan John T | $938,250 | |
| Previous Owner | Mccrossin Kimberly L | $285,000 | |
| Previous Owner | Callahan John T | $200,000 | |
| Previous Owner | Callahan John T | $110,000 |
Source: Public Records
Tax History Compared to Growth
Tax History
| Year | Tax Paid | Tax Assessment Tax Assessment Total Assessment is a certain percentage of the fair market value that is determined by local assessors to be the total taxable value of land and additions on the property. | Land | Improvement |
|---|---|---|---|---|
| 2025 | $3,336 | $770,500 | $270,900 | $499,600 |
| 2024 | $3,161 | $720,000 | $260,500 | $459,500 |
| 2023 | $3,148 | $674,100 | $236,800 | $437,300 |
| 2022 | $4,393 | $784,500 | $400,200 | $384,300 |
| 2021 | $1,392 | $714,600 | $392,400 | $322,200 |
| 2020 | $4,175 | $684,400 | $380,700 | $303,700 |
| 2019 | $4,176 | $676,900 | $380,700 | $296,200 |
| 2018 | $1,289 | $660,100 | $380,700 | $279,400 |
| 2017 | $4,108 | $667,900 | $380,700 | $287,200 |
| 2016 | $4,070 | $623,300 | $380,700 | $242,600 |
| 2015 | $3,989 | $623,300 | $380,700 | $242,600 |
| 2014 | $3,958 | $623,300 | $380,700 | $242,600 |
Source: Public Records
Map
Nearby Homes
- 15 Woodside Park Rd
- 12 Spoonbill Rd
- 26 Center St
- 3 Pinefield Ln
- 95 Center St
- 61 Trotters Ln
- 71 Main St
- 80 Michaels Ave
- 4 Coffey Ln
- 19 Standish Way
- 125 Main St Unit 3
- 467 Main St
- 401 Main St Unit 201
- 401 Main St Unit 101
- 22 Wixon Rd
- 31 Easy St
- 72 Bassett Ln
- 268 Main St
- 20 Aunt Debbys Rd
- 37 Ocean Dr Unit 2