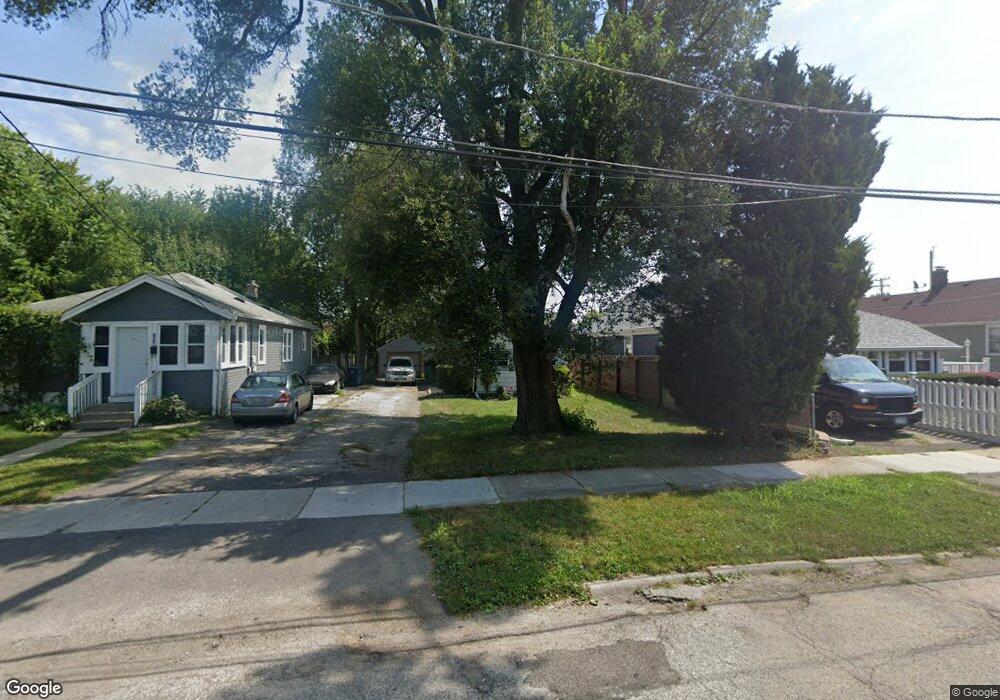
803 Pine St Waukegan, IL 60085
Waukegan Gardens NeighborhoodEstimated Value: $143,000 - $186,000
2
Beds
1
Bath
692
Sq Ft
$232/Sq Ft
Est. Value
About This Home
This home is located at 803 Pine St, Waukegan, IL 60085 and is currently estimated at $160,551, approximately $232 per square foot. 803 Pine St is a home located in Lake County with nearby schools including Glen Flora Elementary School, Edith M Smith Middle School, and Waukegan High School.
Ownership History
Date
Name
Owned For
Owner Type
Purchase Details
Closed on
Aug 11, 2017
Sold by
Lovering Michael S
Bought by
General Properties Llc Series 1001
Current Estimated Value
Purchase Details
Closed on
Jul 22, 2014
Sold by
Nationstar Mortgage Llc
Bought by
Lovering Michael S and Lovering Christopher M
Purchase Details
Closed on
May 21, 2014
Sold by
Lemus Nancy and Case #13 Ch 1128
Bought by
Nationastar Mortgage Llc
Purchase Details
Closed on
Apr 8, 2008
Sold by
Almanza Alonzo G
Bought by
Lemus Nancy and Almanza Nancy
Purchase Details
Closed on
Jul 30, 1997
Sold by
Gilbert Felicita and Gilbert Ronald W
Bought by
Almanza Alonso G and Almanza Nancy
Home Financials for this Owner
Home Financials are based on the most recent Mortgage that was taken out on this home.
Original Mortgage
$45,399
Interest Rate
7.68%
Mortgage Type
FHA
Create a Home Valuation Report for This Property
The Home Valuation Report is an in-depth analysis detailing your home's value as well as a comparison with similar homes in the area
Home Values in the Area
Average Home Value in this Area
Purchase History
| Date | Buyer | Sale Price | Title Company |
|---|---|---|---|
| General Properties Llc Series 1001 | -- | None Available | |
| Lovering Michael S | $15,500 | None Available | |
| Nationastar Mortgage Llc | -- | None Available | |
| Lemus Nancy | -- | None Available | |
| Almanza Alonso G | $30,000 | Ticor Title Insurance Compan |
Source: Public Records
Mortgage History
| Date | Status | Borrower | Loan Amount |
|---|---|---|---|
| Previous Owner | Almanza Alonso G | $45,399 | |
| Closed | Almanza Alonso G | $2,000 |
Source: Public Records
Tax History Compared to Growth
Tax History
| Year | Tax Paid | Tax Assessment Tax Assessment Total Assessment is a certain percentage of the fair market value that is determined by local assessors to be the total taxable value of land and additions on the property. | Land | Improvement |
|---|---|---|---|---|
| 2024 | $2,787 | $32,686 | $8,863 | $23,823 |
| 2023 | $2,507 | $29,553 | $8,014 | $21,539 |
| 2022 | $2,507 | $25,642 | $6,150 | $19,492 |
| 2021 | $2,214 | $21,238 | $5,377 | $15,861 |
| 2020 | $2,243 | $19,785 | $5,009 | $14,776 |
| 2019 | $2,257 | $18,130 | $4,590 | $13,540 |
| 2018 | $2,099 | $16,237 | $5,776 | $10,461 |
| 2017 | $2,059 | $14,365 | $5,110 | $9,255 |
| 2016 | $1,929 | $12,482 | $4,440 | $8,042 |
| 2015 | $1,887 | $11,172 | $3,974 | $7,198 |
| 2014 | $1,267 | $13,028 | $3,068 | $9,960 |
| 2012 | $2,057 | $14,114 | $3,323 | $10,791 |
Source: Public Records
Map
Nearby Homes
- 824 N Butrick St
- 917 N Linden Ave
- 1000 Pine St
- 509 N Butrick St
- 620 N Poplar St
- 702 Franklin St
- 968 Judge Ave
- 1105 Woodlawn Cir
- 522 N Poplar St
- 511 Chestnut St
- 918 N Ash St
- 428 N Poplar St
- 1117 Judge Ave
- 1504 W Glen Flora Ave
- 1038 Indiana Ave
- 1110 N Ash St
- 1005 N Lewis Ave
- 1122 N Ash St
- 1019 N Lewis Ave
- 1213 Grand Ave