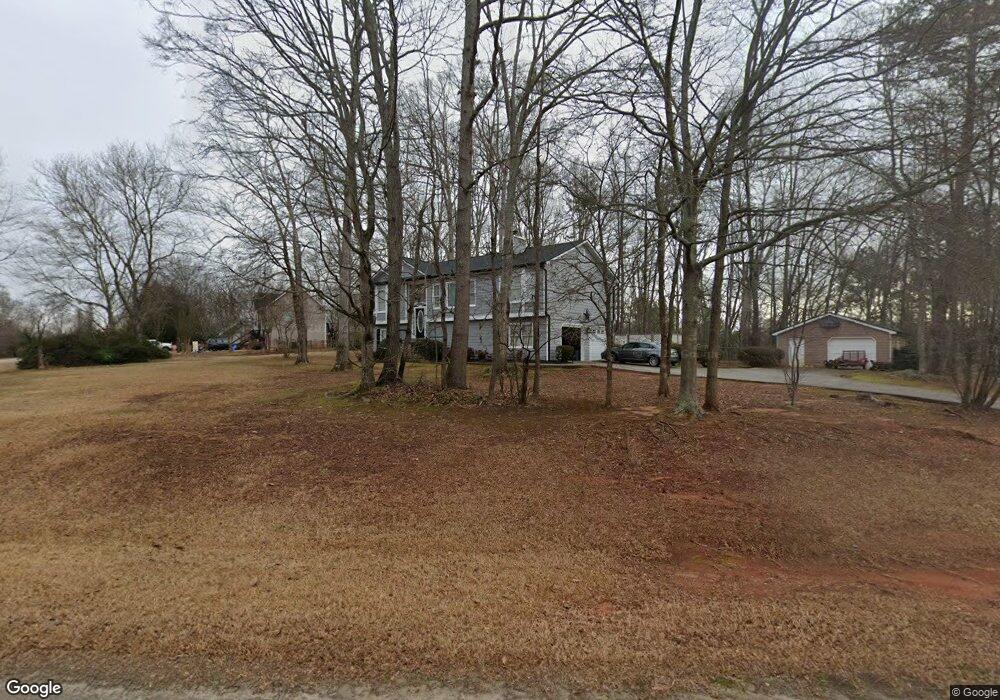
803 Riverview Ln Unit 2 Winder, GA 30680
Estimated Value: $362,757 - $485,000
Studio
3
Baths
2,446
Sq Ft
$177/Sq Ft
Est. Value
About This Home
This home is located at 803 Riverview Ln Unit 2, Winder, GA 30680 and is currently estimated at $432,689, approximately $176 per square foot. 803 Riverview Ln Unit 2 is a home located in Barrow County with nearby schools including Holsenbeck Elementary School, Bear Creek Middle School, and Winder-Barrow High School.
Ownership History
Date
Name
Owned For
Owner Type
Purchase Details
Closed on
May 28, 1999
Sold by
Sindler Jerry D and Sindler Debra K
Bought by
Smith Richard G and Smith Teresa L
Current Estimated Value
Home Financials for this Owner
Home Financials are based on the most recent Mortgage that was taken out on this home.
Original Mortgage
$105,000
Outstanding Balance
$25,738
Interest Rate
6.9%
Mortgage Type
New Conventional
Estimated Equity
$406,951
Purchase Details
Closed on
Jun 24, 1994
Sold by
Baber Kyle L
Bought by
Sindler Jerry D and Sindler Debra K
Home Financials for this Owner
Home Financials are based on the most recent Mortgage that was taken out on this home.
Original Mortgage
$102,710
Interest Rate
8.51%
Mortgage Type
FHA
Purchase Details
Closed on
Mar 22, 1994
Sold by
Cooper Barnette Page
Bought by
Baber Kyle L Fr
Home Financials for this Owner
Home Financials are based on the most recent Mortgage that was taken out on this home.
Original Mortgage
$81,000
Interest Rate
8%
Mortgage Type
Construction
Create a Home Valuation Report for This Property
The Home Valuation Report is an in-depth analysis detailing your home's value as well as a comparison with similar homes in the area
Home Values in the Area
Average Home Value in this Area
Purchase History
| Date | Buyer | Sale Price | Title Company |
|---|---|---|---|
| Smith Richard G | $135,000 | -- | |
| Sindler Jerry D | $105,300 | -- | |
| Baber Kyle L Fr | $16,500 | -- |
Source: Public Records
Mortgage History
| Date | Status | Borrower | Loan Amount |
|---|---|---|---|
| Open | Smith Richard G | $105,000 | |
| Previous Owner | Sindler Jerry D | $102,710 | |
| Previous Owner | Baber Kyle L Fr | $81,000 |
Source: Public Records
Tax History
| Year | Tax Paid | Tax Assessment Tax Assessment Total Assessment is a certain percentage of the fair market value that is determined by local assessors to be the total taxable value of land and additions on the property. | Land | Improvement |
|---|---|---|---|---|
| 2025 | $891 | $109,749 | $20,000 | $89,749 |
| 2024 | $2,310 | $105,157 | $18,000 | $87,157 |
| 2023 | $1,896 | $105,557 | $18,000 | $87,557 |
| 2022 | $1,764 | $66,357 | $11,400 | $54,957 |
| 2021 | $1,863 | $67,033 | $11,400 | $55,633 |
| 2020 | $1,859 | $67,033 | $11,400 | $55,633 |
| 2019 | $1,888 | $67,033 | $11,400 | $55,633 |
| 2018 | $1,701 | $59,980 | $11,400 | $48,580 |
| 2017 | $1,455 | $49,986 | $11,400 | $38,586 |
| 2016 | $1,384 | $48,617 | $11,400 | $37,217 |
| 2015 | $1,404 | $49,092 | $11,400 | $37,692 |
| 2014 | $1,256 | $43,767 | $5,586 | $38,181 |
| 2013 | -- | $41,979 | $5,586 | $36,393 |
Source: Public Records
Map
Nearby Homes
- 281 Delightful Way Unit 7
- 296 Delightful Way Unit 22
- 253 Delightful Way Unit 6
- 230 Delightful Way Unit 23
- 162 Delightful Way Unit 28
- 63 Delightful Way Unit 1
- 1328 Jefferson Hwy
- 1370 Old Winder Jefferson Hwy
- 698 Melinda Dr
- 0 W H Hayes Rd
- 56 Candler Park Ct
- 1553 Shoal Creek Dr
- 1556 Shoal Creek Dr
- 508 Pleasant Hill Church Rd NE
- 614 Anns Way
- 671 Ebenezer Church Rd
- 855 Geiger Rd
- 388 Kay Dr Unit 1
- 0 Dogwood Trail Unit 10675677
- 0 Dogwood Trail Unit 7706915
- 1051 Riverbluff Dr
- 1051 River Bluff Dr Unit 2
- 797 Riverview Ln Unit 2
- 1042 River Bluff Dr
- 800 Riverview Ln Unit 2
- 791 Riverview Ln
- 1055 River Bluff Dr
- 794 Riverview Ln Unit 2
- 0 River Bluff Dr Unit 23 7566419
- 0 River Bluff Dr Unit 23 8129185
- 0 River Bluff Dr Unit 23 8138604
- 0 River Bluff Dr Unit 23 8176671
- 0 River Bluff Dr Unit 8176673
- Lot 23 River Bluff Dr
- 0 River Bluff Dr Unit 8893549
- 0 River Bluff Dr Unit 6810640
- 0 River Bluff Dr Unit Lot 23 8715740
- 1033 River Bluff Dr Unit 2
- 1033 River Bluff Dr
- 1033 Riverbluff Dr
Your Personal Tour Guide
Ask me questions while you tour the home.