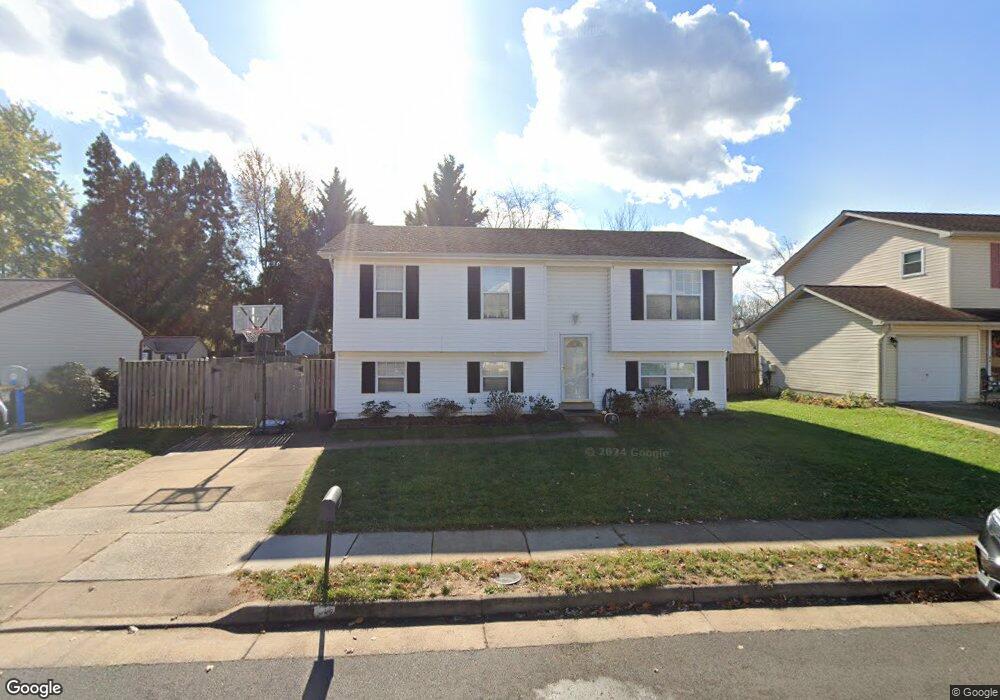
803 Rust Dr NE Leesburg, VA 20176
Estimated Value: $577,646 - $636,000
3
Beds
1
Bath
1,032
Sq Ft
$583/Sq Ft
Est. Value
About This Home
This home is located at 803 Rust Dr NE, Leesburg, VA 20176 and is currently estimated at $601,412, approximately $582 per square foot. 803 Rust Dr NE is a home located in Loudoun County with nearby schools including Leesburg Elementary School, Smart's Mill Middle School, and Tuscarora High School.
Ownership History
Date
Name
Owned For
Owner Type
Purchase Details
Closed on
Aug 27, 2021
Sold by
Amaya Oscar Armando Benitez and Amaya Dora B
Bought by
Amaya Oscar Armando Benitez
Current Estimated Value
Purchase Details
Closed on
Jul 22, 2019
Sold by
Benitez Oscar and Amaya Dora Bertha
Bought by
Benitez Oscar Armando and Benitez Dora B
Purchase Details
Closed on
Oct 29, 2001
Sold by
Migliaccio Dianne
Bought by
Benitez Oscar and Rivera,Santos
Home Financials for this Owner
Home Financials are based on the most recent Mortgage that was taken out on this home.
Original Mortgage
$218,724
Outstanding Balance
$86,118
Interest Rate
6.82%
Estimated Equity
$515,294
Purchase Details
Closed on
Feb 28, 2000
Sold by
Newman David E
Bought by
Migliaccio Diane
Home Financials for this Owner
Home Financials are based on the most recent Mortgage that was taken out on this home.
Original Mortgage
$153,236
Interest Rate
8.21%
Create a Home Valuation Report for This Property
The Home Valuation Report is an in-depth analysis detailing your home's value as well as a comparison with similar homes in the area
Home Values in the Area
Average Home Value in this Area
Purchase History
| Date | Buyer | Sale Price | Title Company |
|---|---|---|---|
| Amaya Oscar Armando Benitez | -- | None Available | |
| Benitez Oscar Armando | -- | None Available | |
| Benitez Oscar | $222,000 | -- | |
| Migliaccio Diane | $154,500 | -- |
Source: Public Records
Mortgage History
| Date | Status | Borrower | Loan Amount |
|---|---|---|---|
| Open | Benitez Oscar | $218,724 | |
| Previous Owner | Migliaccio Diane | $153,236 |
Source: Public Records
Tax History Compared to Growth
Tax History
| Year | Tax Paid | Tax Assessment Tax Assessment Total Assessment is a certain percentage of the fair market value that is determined by local assessors to be the total taxable value of land and additions on the property. | Land | Improvement |
|---|---|---|---|---|
| 2025 | $4,342 | $539,370 | $254,500 | $284,870 |
| 2024 | $4,384 | $506,840 | $237,300 | $269,540 |
| 2023 | $4,549 | $519,920 | $222,300 | $297,620 |
| 2022 | $3,948 | $443,590 | $197,300 | $246,290 |
| 2021 | $3,875 | $395,450 | $178,900 | $216,550 |
| 2020 | $3,710 | $358,470 | $178,900 | $179,570 |
| 2019 | $3,658 | $350,030 | $178,900 | $171,130 |
| 2018 | $3,591 | $330,930 | $148,900 | $182,030 |
| 2017 | $3,652 | $324,660 | $148,900 | $175,760 |
| 2016 | $3,653 | $319,010 | $0 | $0 |
| 2015 | $584 | $170,370 | $0 | $170,370 |
| 2014 | $583 | $169,650 | $0 | $169,650 |
Source: Public Records
Map
Nearby Homes
- 710 North St NE
- 514 Covington Terrace NE
- 1102 Huntmaster Terrace NE Unit 301
- 1129 Huntmaster Terrace NE Unit 301
- 503 Richmond Square NE
- 523 Currant Terrace NE
- 608 Blue Ridge Ave NE
- 1148 Keokuk Terrace NE
- 1204 James Rifle Ct NE
- 216 Wildman St NE
- BIRKHALL Plan at Brickyard
- HIGHGROVE Plan at Brickyard
- BALMORAL Plan at Brickyard
- 293 Ariel Dr NE
- 276 Ariel Dr NE
- 105 Burt Ct NE
- 815 Catoctin Cir NE
- 706 Amber Ct NE
- 732 Balls Bluff Rd NE
- 820 Ferndale Terrace NE
- 805 Rust Dr NE
- 801 Rust Dr NE
- 804 Cattail Ln NE
- 802 Cattail Ln NE
- 807 Rust Dr NE
- 806 Cattail Ln NE
- 804 Rust Dr NE
- 806 Rust Dr NE
- 802 Rust Dr NE
- 808 Cattail Ln NE
- 809 Rust Dr NE
- 808 Rust Dr NE
- 0 Courtney Meadow Ct Unit 1008256918
- 0 Sydney Meadow Ct Unit 1008252432
- 0 Tarleton Dr Unit 1008230732
- 0 Courtney Meadow Ct Unit 1008227952
- 0 Sydney Meadow Ct Unit 1008223016
- 0 Sydney Meadow Ct Unit 1008222238
- 0 Tarleton Dr Unit 1008203894
- 0 Courtney Meadow Ct Unit 1008197718