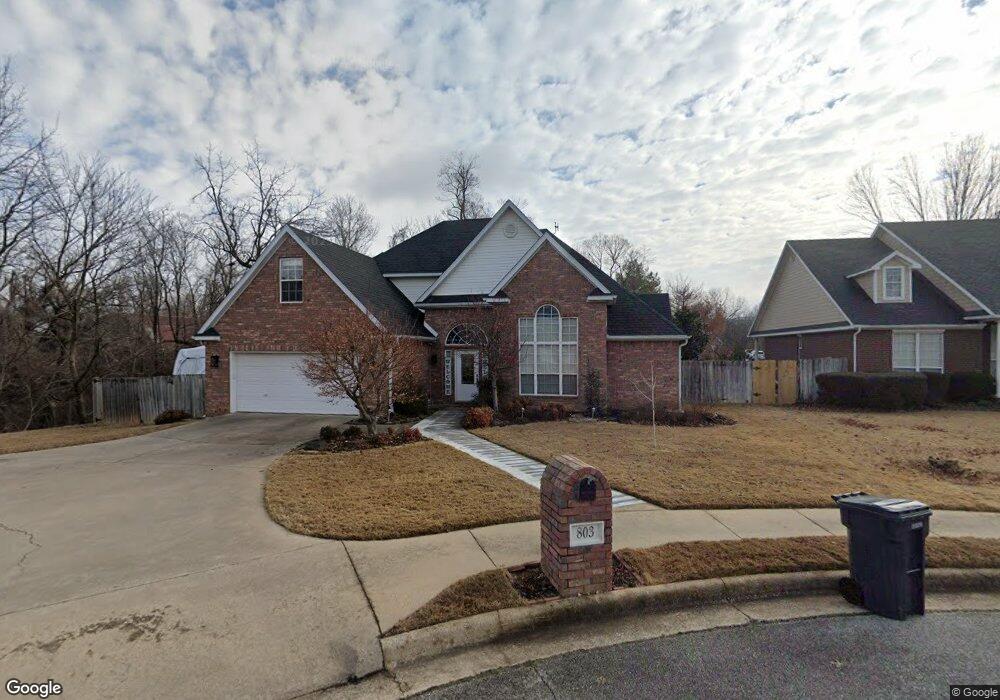
803 S 54th Place Rogers, AR 72758
Estimated Value: $548,000 - $748,763
--
Bed
4
Baths
3,108
Sq Ft
$215/Sq Ft
Est. Value
About This Home
This home is located at 803 S 54th Place, Rogers, AR 72758 and is currently estimated at $669,691, approximately $215 per square foot. 803 S 54th Place is a home located in Benton County with nearby schools including Reagan Elementary School, Oakdale Middle School, and Rogers Heritage High School.
Ownership History
Date
Name
Owned For
Owner Type
Purchase Details
Closed on
Dec 4, 2004
Bought by
Rasche Living Trust
Current Estimated Value
Purchase Details
Closed on
Feb 2, 2004
Bought by
Rasche Tr
Purchase Details
Closed on
Mar 5, 2002
Bought by
Rasche
Purchase Details
Closed on
Jul 3, 2000
Bought by
Pinkley C
Purchase Details
Closed on
Jul 30, 1999
Bought by
Pinkley 3Lts
Create a Home Valuation Report for This Property
The Home Valuation Report is an in-depth analysis detailing your home's value as well as a comparison with similar homes in the area
Home Values in the Area
Average Home Value in this Area
Purchase History
| Date | Buyer | Sale Price | Title Company |
|---|---|---|---|
| Rasche Living Trust | -- | -- | |
| Rasche Tr | -- | -- | |
| Rasche | $245,000 | -- | |
| Pinkley C | -- | -- | |
| Pinkley 3Lts | $105,000 | -- |
Source: Public Records
Tax History Compared to Growth
Tax History
| Year | Tax Paid | Tax Assessment Tax Assessment Total Assessment is a certain percentage of the fair market value that is determined by local assessors to be the total taxable value of land and additions on the property. | Land | Improvement |
|---|---|---|---|---|
| 2025 | $4,260 | $104,982 | $20,000 | $84,982 |
| 2024 | $3,967 | $104,982 | $20,000 | $84,982 |
| 2023 | $3,778 | $71,420 | $15,000 | $56,420 |
| 2022 | $3,401 | $71,420 | $15,000 | $56,420 |
| 2021 | $3,221 | $71,420 | $15,000 | $56,420 |
| 2020 | $3,052 | $62,420 | $8,600 | $53,820 |
| 2019 | $3,052 | $62,420 | $8,600 | $53,820 |
| 2018 | $3,077 | $62,420 | $8,600 | $53,820 |
| 2017 | $2,680 | $62,420 | $8,600 | $53,820 |
| 2016 | $2,680 | $62,420 | $8,600 | $53,820 |
| 2015 | $2,942 | $55,610 | $8,000 | $47,610 |
| 2014 | $2,484 | $53,570 | $8,000 | $45,570 |
Source: Public Records
Map
Nearby Homes
- 4606 W Centre Ct
- 5703 W Casey Dr
- 324 S 52nd St
- 0 S Dodson Rd
- 5879 W Venture Park Blvd
- 5801 W Venture Park Blvd
- 9348 Arkansas 12
- 315 S Promenade Blvd
- 3401 SE K St
- 3319 Mp Pkwy Unit 305
- 3319 Mp Pkwy Unit 302
- 3319 Mp Pkwy Unit 208
- 3319 Mp Pkwy Unit 103
- 3319 Mp Pkwy Unit 304
- 3329 Mp Pkwy Unit 208
- 3319 Mp Pkwy Unit 207
- 3329 Mp Pkwy Unit 303
- 3329 Mp Pkwy Unit 108
- 3329 Mp Pkwy Unit 306
- 3329 Mp Pkwy Unit 203
- 1.54 Acres Pullum St
- 805 S 54th Place
- 5403 W Redbud St
- 802 S 54th Place
- 804 S 54th Place
- 5407 W Redbud St
- 5302 W Redbud St
- 5304 W Redbud St
- 630 S Horsebarn Rd
- 5409 W Redbud St
- 5404 W Redbud St
- 5406 W Redbud St
- 5402 W Redbud St
- 5306 W Redbud St
- 5408 W Redbud St
- 5411 W Redbud St
- 5410 W Redbud St
- 5412 W Redbud St
- 728 S Horsebarn Rd
- 5403 W Dogwood St