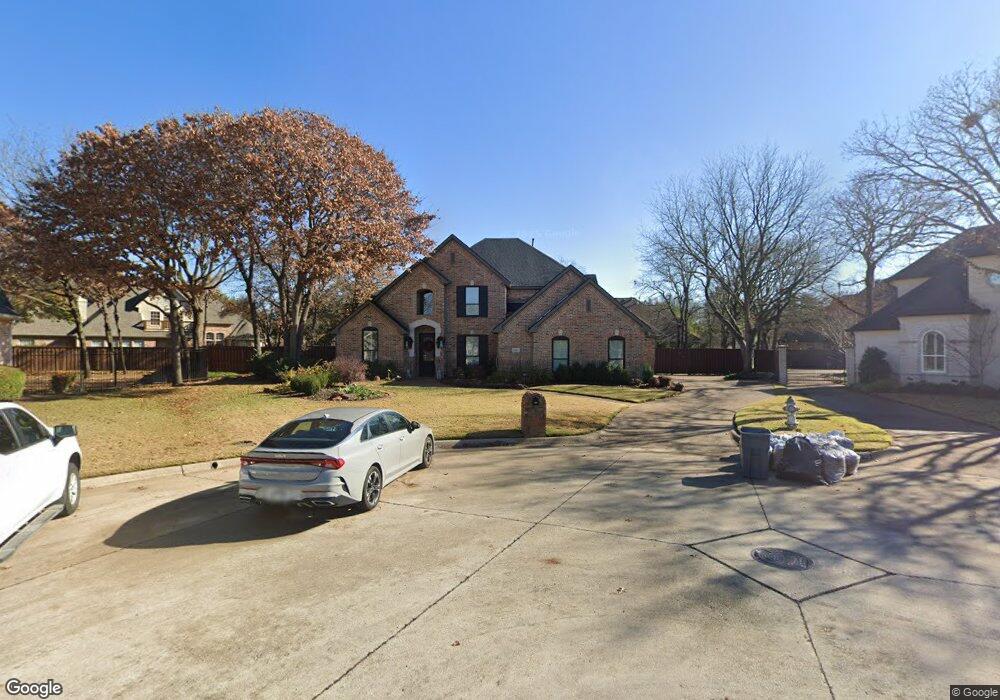
803 Shorecrest Ct Southlake, TX 76092
Estimated Value: $1,218,000 - $1,335,000
4
Beds
3
Baths
3,869
Sq Ft
$328/Sq Ft
Est. Value
About This Home
This home is located at 803 Shorecrest Ct, Southlake, TX 76092 and is currently estimated at $1,267,456, approximately $327 per square foot. 803 Shorecrest Ct is a home located in Tarrant County with nearby schools including Robert High Rockenbaugh Elementary School, Eubanks Intermediate School, and George Dawson Middle School.
Ownership History
Date
Name
Owned For
Owner Type
Purchase Details
Closed on
Feb 7, 2018
Sold by
Devage Alexander J and Devage Alexander Jaems
Bought by
Devage Alexander James and Devage Tracy Sue
Current Estimated Value
Purchase Details
Closed on
Mar 27, 1996
Sold by
Pierce Homes Inc
Bought by
Devage Alexander J and Devage Tracy S
Home Financials for this Owner
Home Financials are based on the most recent Mortgage that was taken out on this home.
Original Mortgage
$266,000
Interest Rate
7.35%
Purchase Details
Closed on
Sep 26, 1995
Sold by
Southlake Joint Venture
Bought by
Pierce Homes Inc
Home Financials for this Owner
Home Financials are based on the most recent Mortgage that was taken out on this home.
Original Mortgage
$252,000
Interest Rate
7.88%
Create a Home Valuation Report for This Property
The Home Valuation Report is an in-depth analysis detailing your home's value as well as a comparison with similar homes in the area
Home Values in the Area
Average Home Value in this Area
Purchase History
| Date | Buyer | Sale Price | Title Company |
|---|---|---|---|
| Devage Alexander James | -- | None Available | |
| Devage Alexander J | -- | Fidelity National Title Agen | |
| Pierce Homes Inc | -- | Fidelity National Title Agen |
Source: Public Records
Mortgage History
| Date | Status | Borrower | Loan Amount |
|---|---|---|---|
| Closed | Devage Alexander J | $266,000 | |
| Previous Owner | Pierce Homes Inc | $252,000 |
Source: Public Records
Tax History Compared to Growth
Tax History
| Year | Tax Paid | Tax Assessment Tax Assessment Total Assessment is a certain percentage of the fair market value that is determined by local assessors to be the total taxable value of land and additions on the property. | Land | Improvement |
|---|---|---|---|---|
| 2025 | $12,038 | $1,120,517 | $263,400 | $857,117 |
| 2024 | $12,038 | $1,120,517 | $263,400 | $857,117 |
| 2023 | $15,759 | $1,144,369 | $263,400 | $880,969 |
| 2022 | $16,958 | $899,981 | $175,600 | $724,381 |
| 2021 | $16,292 | $733,880 | $175,600 | $558,280 |
| 2020 | $14,932 | $649,600 | $158,040 | $491,560 |
| 2019 | $16,402 | $677,347 | $150,000 | $527,347 |
| 2018 | $14,665 | $643,605 | $140,000 | $503,605 |
| 2017 | $15,897 | $641,363 | $125,000 | $516,363 |
| 2016 | $15,405 | $621,719 | $125,000 | $496,719 |
| 2015 | $13,152 | $565,000 | $95,000 | $470,000 |
| 2014 | $13,152 | $543,800 | $55,000 | $488,800 |
Source: Public Records
Map
Nearby Homes
- 802 Princeton Ct
- 800 Woodcrest Ct
- 806 Shadow Glen Dr
- 608 Stratford Dr
- 806 Ridgedale Ct
- 305 Canyon Lake Dr
- 900 Kingsbury Way
- 1196 W Continental Blvd
- 305 Sheffield Dr
- 205 Edinburgh Ct
- 102 Springbrook Ct
- 1002 Chimney Hill Trail
- 1206 Oakwood Trail
- 203 Manor Place
- 351 S White Chapel Blvd
- 1212 Oakwood Trail
- 221 Pine Dr
- 300 Shady Oaks Dr
- 1205 Scenic Dr
- 690 S Peytonville Ave
- 805 Shorecrest Ct
- 801 Shorecrest Ct
- 810 Parkdale Dr
- 802 Parkdale Dr
- 807 Shorecrest Ct
- 814 Parkdale Dr
- 800 Parkdale Dr
- 816 Parkdale Dr
- 818 Parkdale Dr
- 712 Shorecrest Dr
- 714 Shorecrest Dr
- 820 Parkdale Dr
- 807 Parkdale Dr
- 710 Shorecrest Dr
- 811 Parkdale Dr
- 805 Parkdale Dr
- 809 Parkdale Dr
- 813 Parkdale Dr
- 803 Parkdale Dr
- 716 Shorecrest Dr