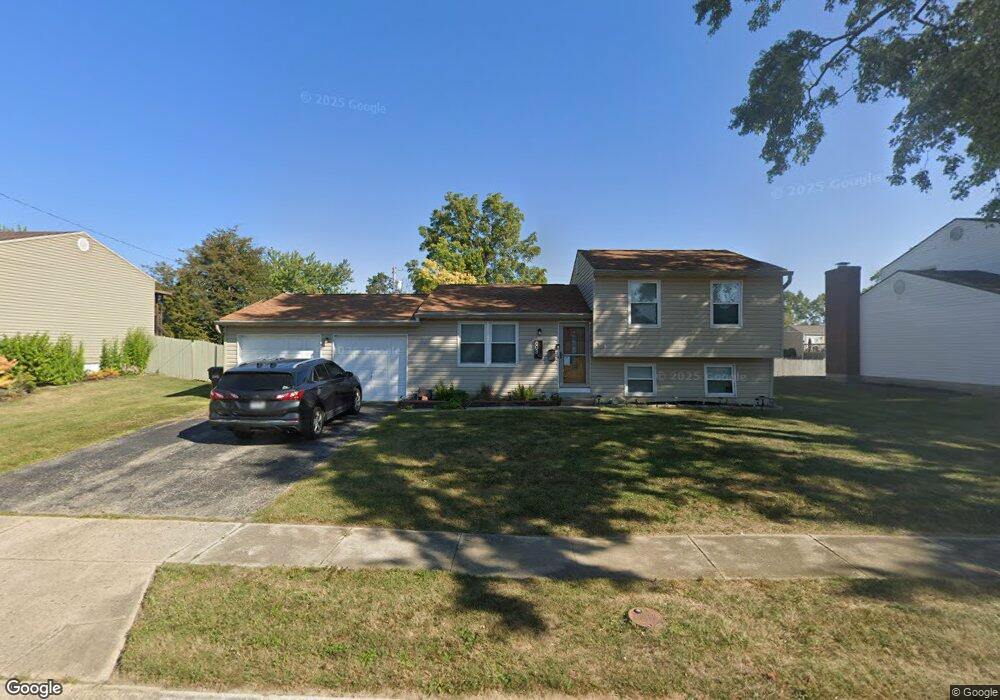
803 Sipos Cir Englewood, OH 45322
Estimated Value: $177,000 - $221,000
3
Beds
2
Baths
936
Sq Ft
$214/Sq Ft
Est. Value
About This Home
This home is located at 803 Sipos Cir, Englewood, OH 45322 and is currently estimated at $200,677, approximately $214 per square foot. 803 Sipos Cir is a home located in Montgomery County with nearby schools including Northmont High School, Trotwood Preparatory & Fitness Academy, and Imagine Schools - Woodbury Academy.
Ownership History
Date
Name
Owned For
Owner Type
Purchase Details
Closed on
Feb 7, 2018
Sold by
Newsome Matthew K
Bought by
King Heath
Current Estimated Value
Home Financials for this Owner
Home Financials are based on the most recent Mortgage that was taken out on this home.
Original Mortgage
$119,310
Outstanding Balance
$100,943
Interest Rate
3.95%
Mortgage Type
New Conventional
Estimated Equity
$99,734
Purchase Details
Closed on
Sep 27, 2012
Sold by
Howard Joan M
Bought by
Fifth Third Mortgage Co
Purchase Details
Closed on
Jan 18, 2012
Sold by
Fifth Third Mortgage Co
Bought by
Newsome Matthew K
Home Financials for this Owner
Home Financials are based on the most recent Mortgage that was taken out on this home.
Original Mortgage
$48,150
Interest Rate
3.32%
Mortgage Type
Future Advance Clause Open End Mortgage
Purchase Details
Closed on
Oct 23, 1997
Sold by
Howard Todd R
Bought by
Howard Joan M
Create a Home Valuation Report for This Property
The Home Valuation Report is an in-depth analysis detailing your home's value as well as a comparison with similar homes in the area
Home Values in the Area
Average Home Value in this Area
Purchase History
| Date | Buyer | Sale Price | Title Company |
|---|---|---|---|
| King Heath | $123,000 | Partners Land Title Agency | |
| Fifth Third Mortgage Co | $40,000 | None Available | |
| Newsome Matthew K | $53,500 | Landmark Title Agency South | |
| Howard Joan M | -- | -- |
Source: Public Records
Mortgage History
| Date | Status | Borrower | Loan Amount |
|---|---|---|---|
| Open | King Heath | $119,310 | |
| Previous Owner | Newsome Matthew K | $48,150 |
Source: Public Records
Tax History Compared to Growth
Tax History
| Year | Tax Paid | Tax Assessment Tax Assessment Total Assessment is a certain percentage of the fair market value that is determined by local assessors to be the total taxable value of land and additions on the property. | Land | Improvement |
|---|---|---|---|---|
| 2024 | $3,512 | $61,590 | $9,700 | $51,890 |
| 2023 | $3,512 | $61,590 | $9,700 | $51,890 |
| 2022 | $3,209 | $43,310 | $6,830 | $36,480 |
| 2021 | $2,769 | $37,220 | $6,830 | $30,390 |
| 2020 | $2,718 | $37,220 | $6,830 | $30,390 |
| 2019 | $2,312 | $28,350 | $7,850 | $20,500 |
| 2018 | $2,270 | $28,350 | $7,850 | $20,500 |
| 2017 | $2,255 | $28,350 | $7,850 | $20,500 |
| 2016 | $2,186 | $27,000 | $6,830 | $20,170 |
| 2015 | $1,999 | $27,000 | $6,830 | $20,170 |
| 2014 | $1,999 | $27,000 | $6,830 | $20,170 |
| 2012 | -- | $35,500 | $7,550 | $27,950 |
Source: Public Records
Map
Nearby Homes
- 803 Albert St
- 206 Lodestone Dr
- 104 Silverstone Dr
- 717 Woodlawn Ave
- 109 Silverstone Dr
- 520 S Main St
- 607 Albert St
- 510 Rohr Ln
- 718 Bonnycastle Ave
- 510 Lambert Ln
- 108 Tate Ave
- 534 Unger Ave
- 208 S Walnut St
- 1010 Heathwood Dr
- 505 Durst Dr
- 123 Chestnut St
- 1017 Terracewood Dr
- 1008 Merrywood Dr
- 206 Gardengrove Way
- 108 Denwood Trail