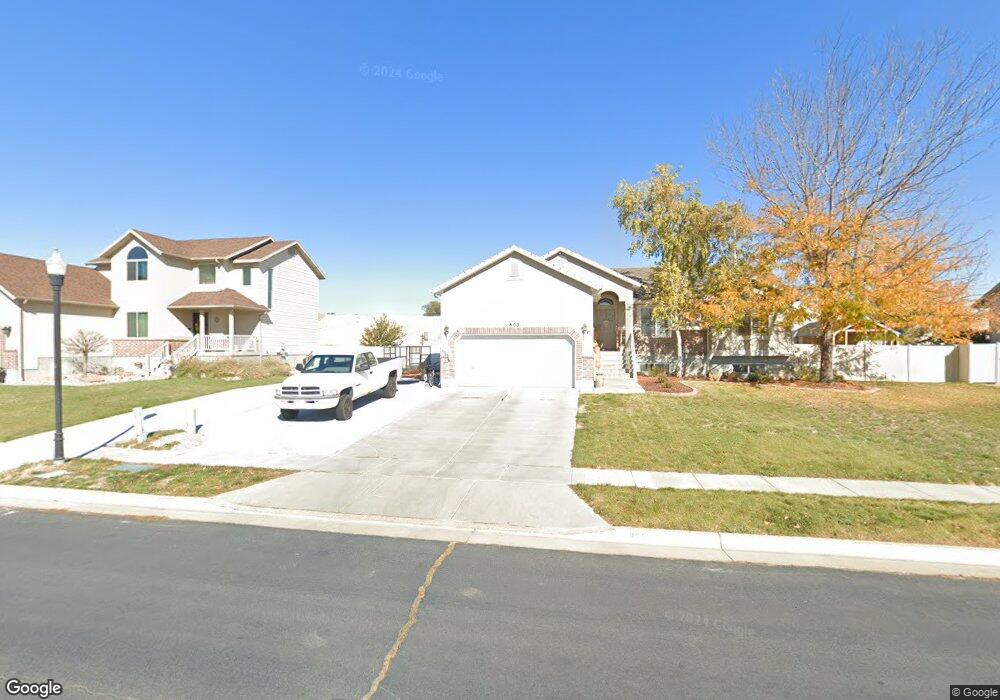
803 St Andrews Dr Syracuse, UT 84075
Estimated Value: $562,000 - $595,928
3
Beds
2
Baths
2,816
Sq Ft
$206/Sq Ft
Est. Value
About This Home
This home is located at 803 St Andrews Dr, Syracuse, UT 84075 and is currently estimated at $579,732, approximately $205 per square foot. 803 St Andrews Dr is a home located in Davis County with nearby schools including Buffalo Point School, Syracuse Junior High School, and Syracuse High School.
Ownership History
Date
Name
Owned For
Owner Type
Purchase Details
Closed on
May 10, 2018
Sold by
Mangrum Brock and Mangrum Catrina
Bought by
Stuart Paul Thomas and Stuart Alisha Bate
Current Estimated Value
Home Financials for this Owner
Home Financials are based on the most recent Mortgage that was taken out on this home.
Original Mortgage
$270,000
Outstanding Balance
$231,979
Interest Rate
4.4%
Mortgage Type
New Conventional
Estimated Equity
$347,753
Purchase Details
Closed on
Jul 31, 2007
Sold by
Mangrum Brock
Bought by
Mangrum Brock and Mangrum Catrina
Home Financials for this Owner
Home Financials are based on the most recent Mortgage that was taken out on this home.
Original Mortgage
$34,090
Interest Rate
6.66%
Mortgage Type
Stand Alone Second
Purchase Details
Closed on
Jan 5, 2005
Sold by
Dennis Higley Inc
Bought by
Mangrum Brock and Mangrum Catrina
Purchase Details
Closed on
Jan 28, 2004
Sold by
Blackburn Jones Real Estate Inc
Bought by
Dennis Higley Inc and Dhi Construction
Create a Home Valuation Report for This Property
The Home Valuation Report is an in-depth analysis detailing your home's value as well as a comparison with similar homes in the area
Home Values in the Area
Average Home Value in this Area
Purchase History
| Date | Buyer | Sale Price | Title Company |
|---|---|---|---|
| Stuart Paul Thomas | -- | First American Title | |
| Mangrum Brock | -- | Accommodation | |
| Mangrum Brock | -- | Mountain View Title & Escrow | |
| Mangrum Brock | -- | None Available | |
| Dennis Higley Inc | -- | First American Title Co |
Source: Public Records
Mortgage History
| Date | Status | Borrower | Loan Amount |
|---|---|---|---|
| Open | Stuart Paul Thomas | $270,000 | |
| Previous Owner | Mangrum Brock | $34,090 | |
| Closed | Mangrum Brock | $0 |
Source: Public Records
Tax History Compared to Growth
Tax History
| Year | Tax Paid | Tax Assessment Tax Assessment Total Assessment is a certain percentage of the fair market value that is determined by local assessors to be the total taxable value of land and additions on the property. | Land | Improvement |
|---|---|---|---|---|
| 2025 | $3,021 | $291,500 | $113,600 | $177,900 |
| 2024 | $2,905 | $282,150 | $94,322 | $187,828 |
| 2023 | $2,701 | $478,000 | $139,229 | $338,771 |
| 2022 | $2,931 | $284,350 | $71,792 | $212,558 |
| 2021 | $2,650 | $398,000 | $104,409 | $293,591 |
| 2020 | $2,427 | $353,000 | $86,460 | $266,540 |
| 2019 | $2,222 | $319,000 | $89,096 | $229,904 |
| 2018 | $1,972 | $281,000 | $85,948 | $195,052 |
| 2016 | $1,734 | $129,580 | $34,907 | $94,673 |
| 2015 | $1,669 | $118,800 | $34,907 | $83,893 |
| 2014 | $1,578 | $114,471 | $34,907 | $79,564 |
| 2013 | -- | $109,889 | $32,711 | $77,178 |
Source: Public Records
Map
Nearby Homes
- 851 S 3525 W
- 3565 W 800 S
- 3649 W 800 S
- 3661 W 800 S
- 3627 W Augusta Dr
- 3736 W 1225 S
- 3867 Rungsted Cir
- 1441 Brookshire Dr
- 3564 Princeville Dr
- 3951 Baltimore Cir
- 4105 W 550 S
- 835 S Criddle Rd
- 2840 W 1200 S
- 1084 S 4090 W
- 3882 Turnberry Dr
- 4244 W 625 S
- 3849 W 50 S Unit 426
- 164 S 2875 W
- 2633 N 2080 W Unit 180
- 2623 N 2080 W Unit 178
- 803 Saint Andrews Dr
- 791 Saint Andrews Dr
- 791 St Andrews Dr
- 815 Saint Andrews Dr
- 806 Saint Andrews Dr
- 777 St Andrews Dr
- 818 Saint Andrews Dr
- 777 Saint Andrews Dr
- 827 Saint Andrews Dr
- 827 St Andrews Dr
- 818 St Andrews Dr
- 794 Saint Andrews Dr
- 830 St Andrews Dr
- 830 Saint Andrews Dr
- 780 St Andrews Dr
- 849 Jupiter Hills Cir
- 839 St Andrews Dr
- 839 Saint Andrews Dr
- 765 St Andrews Dr
- 765 Saint Andrews Dr