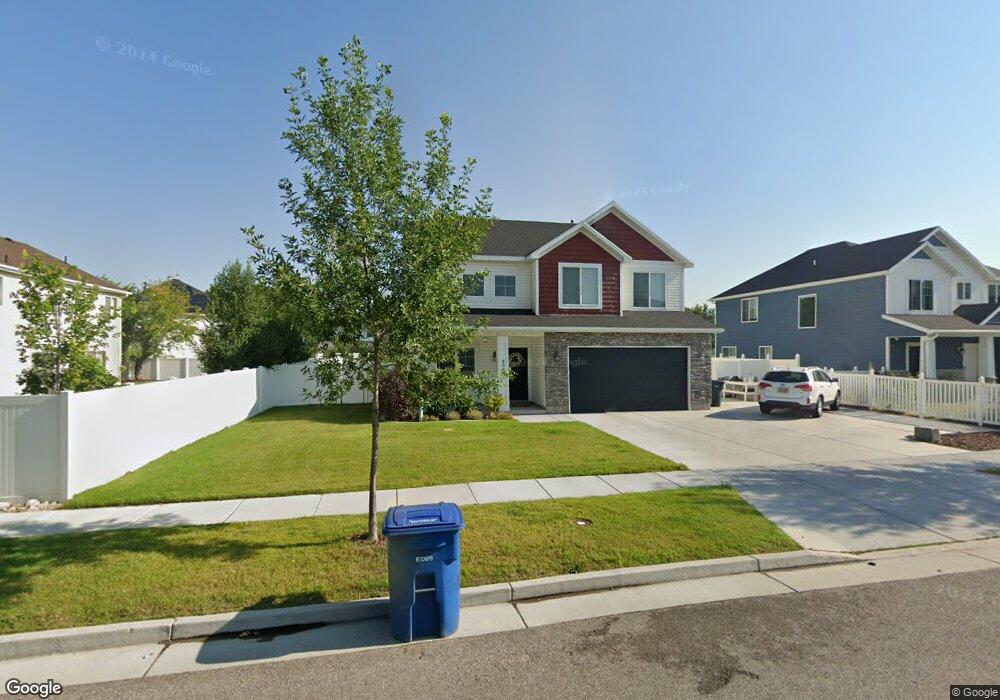
803 W 1060 S Logan, UT 84321
Woodruff NeighborhoodEstimated Value: $493,522 - $509,000
--
Bed
--
Bath
2,413
Sq Ft
$209/Sq Ft
Est. Value
About This Home
This home is located at 803 W 1060 S, Logan, UT 84321 and is currently estimated at $503,381, approximately $208 per square foot. 803 W 1060 S is a home with nearby schools including Woodruff School, Mount Logan Middle School, and Logan High School.
Ownership History
Date
Name
Owned For
Owner Type
Purchase Details
Closed on
Oct 15, 2018
Sold by
Kartchner Homes Cv Divison Inc
Bought by
Fenn Tyrell and Fenn Melanie
Current Estimated Value
Home Financials for this Owner
Home Financials are based on the most recent Mortgage that was taken out on this home.
Original Mortgage
$233,728
Outstanding Balance
$203,405
Interest Rate
4.5%
Mortgage Type
New Conventional
Estimated Equity
$299,976
Purchase Details
Closed on
May 16, 2018
Sold by
Kartchner Land Management Inc
Bought by
Kartchner Homes Cv Division Inc
Home Financials for this Owner
Home Financials are based on the most recent Mortgage that was taken out on this home.
Original Mortgage
$219,000
Interest Rate
4.4%
Mortgage Type
Purchase Money Mortgage
Create a Home Valuation Report for This Property
The Home Valuation Report is an in-depth analysis detailing your home's value as well as a comparison with similar homes in the area
Home Values in the Area
Average Home Value in this Area
Purchase History
| Date | Buyer | Sale Price | Title Company |
|---|---|---|---|
| Fenn Tyrell | -- | Cache Title Logan | |
| Kartchner Homes Cv Division Inc | -- | None Available |
Source: Public Records
Mortgage History
| Date | Status | Borrower | Loan Amount |
|---|---|---|---|
| Open | Fenn Tyrell | $233,728 | |
| Previous Owner | Kartchner Homes Cv Division Inc | $219,000 |
Source: Public Records
Tax History Compared to Growth
Tax History
| Year | Tax Paid | Tax Assessment Tax Assessment Total Assessment is a certain percentage of the fair market value that is determined by local assessors to be the total taxable value of land and additions on the property. | Land | Improvement |
|---|---|---|---|---|
| 2025 | $2,095 | $270,895 | $0 | $0 |
| 2024 | $215 | $269,560 | $0 | $0 |
| 2023 | $2,238 | $267,245 | $0 | $0 |
| 2022 | $2,397 | $267,245 | $0 | $0 |
| 2021 | $1,993 | $343,365 | $50,000 | $293,365 |
| 2020 | $1,968 | $305,100 | $50,000 | $255,100 |
| 2019 | $2,057 | $305,100 | $50,000 | $255,100 |
| 2018 | $671 | $50,000 | $50,000 | $0 |
| 2017 | $698 | $50,000 | $0 | $0 |
Source: Public Records
Map
Nearby Homes