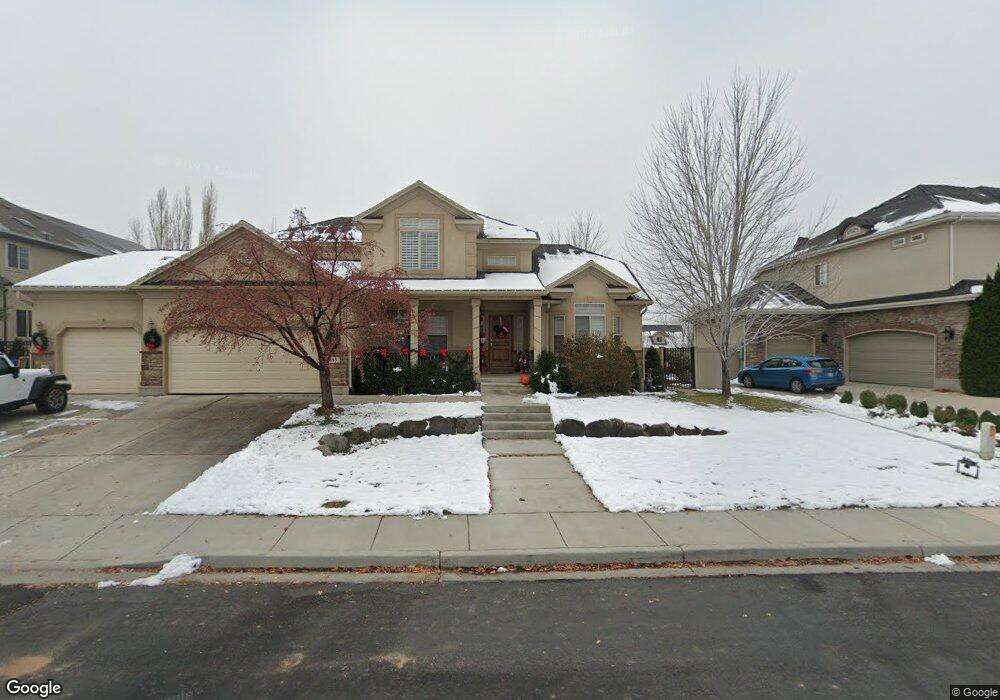
803 W 1500 N Pleasant Grove, UT 84062
Estimated Value: $879,000 - $954,000
4
Beds
3
Baths
3,910
Sq Ft
$237/Sq Ft
Est. Value
About This Home
This home is located at 803 W 1500 N, Pleasant Grove, UT 84062 and is currently estimated at $927,118, approximately $237 per square foot. 803 W 1500 N is a home located in Utah County with nearby schools including Mount Mahogany School, Pleasant Grove Junior High School, and Pleasant Grove High School.
Ownership History
Date
Name
Owned For
Owner Type
Purchase Details
Closed on
Jul 26, 2010
Sold by
Fannie Mae
Bought by
Scott Joshua O and Scott Dalynn
Current Estimated Value
Home Financials for this Owner
Home Financials are based on the most recent Mortgage that was taken out on this home.
Original Mortgage
$297,925
Outstanding Balance
$198,643
Interest Rate
4.71%
Mortgage Type
New Conventional
Estimated Equity
$728,475
Purchase Details
Closed on
May 6, 2010
Sold by
Sorensen Wesley R and Sorensen Pamela E
Bought by
Federal National Mortgage Association
Purchase Details
Closed on
Nov 20, 2007
Sold by
Ivory Homes Ltd
Bought by
Sorensen Wesley R and Sorensen Pamela E
Home Financials for this Owner
Home Financials are based on the most recent Mortgage that was taken out on this home.
Original Mortgage
$48,800
Interest Rate
6.3%
Mortgage Type
Stand Alone Second
Create a Home Valuation Report for This Property
The Home Valuation Report is an in-depth analysis detailing your home's value as well as a comparison with similar homes in the area
Home Values in the Area
Average Home Value in this Area
Purchase History
| Date | Buyer | Sale Price | Title Company |
|---|---|---|---|
| Scott Joshua O | -- | Empire Land Title Inc | |
| Federal National Mortgage Association | $401,587 | Lsi Title Agency Inc | |
| Sorensen Wesley R | -- | Cottonwood Title | |
| Ivory Homes Ltd | -- | Cottonwood Title |
Source: Public Records
Mortgage History
| Date | Status | Borrower | Loan Amount |
|---|---|---|---|
| Open | Scott Joshua O | $297,925 | |
| Previous Owner | Ivory Homes Ltd | $48,800 | |
| Previous Owner | Sorensen Wesley R | $390,500 |
Source: Public Records
Tax History Compared to Growth
Tax History
| Year | Tax Paid | Tax Assessment Tax Assessment Total Assessment is a certain percentage of the fair market value that is determined by local assessors to be the total taxable value of land and additions on the property. | Land | Improvement |
|---|---|---|---|---|
| 2025 | $3,817 | $485,320 | $425,500 | $456,900 |
| 2024 | $3,817 | $445,390 | $0 | $0 |
| 2023 | $3,566 | $435,710 | $0 | $0 |
| 2022 | $3,867 | $470,140 | $0 | $0 |
| 2021 | $3,250 | $601,600 | $242,100 | $359,500 |
| 2020 | $3,070 | $557,100 | $224,200 | $332,900 |
| 2019 | $2,775 | $520,800 | $208,200 | $312,600 |
| 2018 | $2,845 | $504,800 | $192,200 | $312,600 |
| 2017 | $2,631 | $248,545 | $0 | $0 |
| 2016 | $2,621 | $239,030 | $0 | $0 |
| 2015 | $2,731 | $235,895 | $0 | $0 |
| 2014 | $2,482 | $212,355 | $0 | $0 |
Source: Public Records
Map
Nearby Homes
- Konlee Plan at Makin Dreams
- Alexa Plan at Makin Dreams
- Callahan Plan at Makin Dreams
- Hailey Plan at Makin Dreams
- Alydia Plan at Makin Dreams
- Addison Plan at Makin Dreams
- Julia Plan at Makin Dreams
- 1531 N 750 W Unit 4
- Aaron Plan at Makin Dreams
- Amie Plan at Makin Dreams
- Nora Plan at Makin Dreams
- Emmet Plan at Makin Dreams
- Quinn Plan at Makin Dreams
- Chelsea Plan at Makin Dreams
- Jenni Plan at Makin Dreams
- Dakota Plan at Makin Dreams
- Lennon Plan at Makin Dreams
- Eva Plan at Makin Dreams
- Jacqueline Bonus Plan at Makin Dreams
- Stockton Plan at Makin Dreams