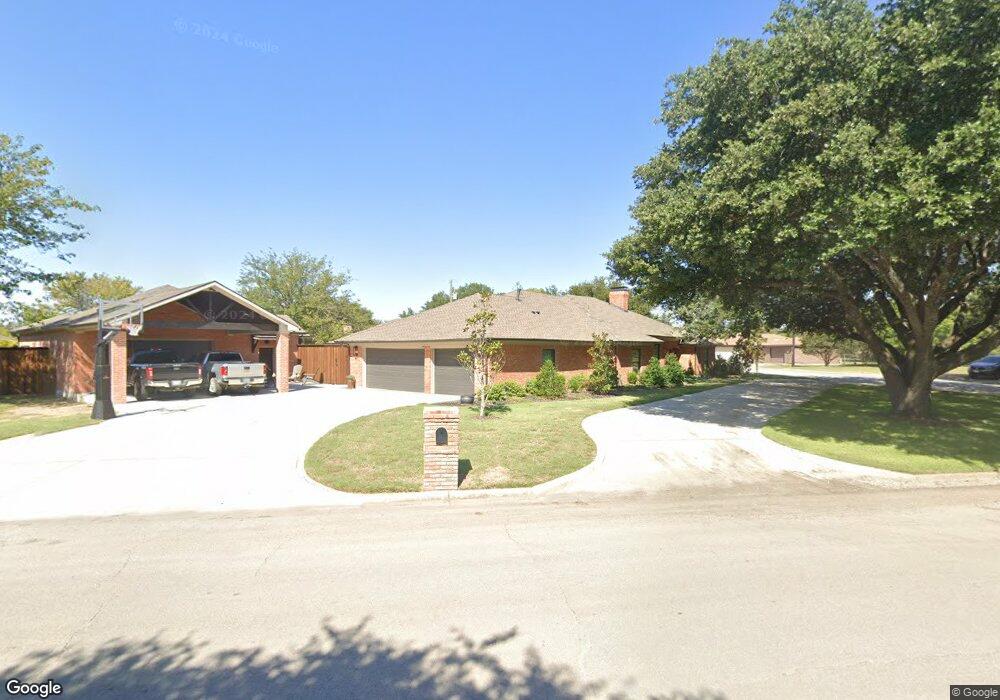
803 W Ash St Celina, TX 75009
Estimated Value: $610,000 - $654,000
4
Beds
3
Baths
3,058
Sq Ft
$208/Sq Ft
Est. Value
About This Home
This home is located at 803 W Ash St, Celina, TX 75009 and is currently estimated at $635,257, approximately $207 per square foot. 803 W Ash St is a home with nearby schools including Celina Primary School, Marcy B. Lykins Elementary School, and Moore Middle School.
Ownership History
Date
Name
Owned For
Owner Type
Purchase Details
Closed on
Mar 16, 2022
Sold by
Settle Toby J and Settle Meredith C
Bought by
Settle Living Trust
Current Estimated Value
Purchase Details
Closed on
Oct 16, 2020
Sold by
Settle Meredith Christie
Bought by
Settle Toby John and Settle Meredith Christie
Purchase Details
Closed on
Dec 30, 2014
Sold by
Duke Christine Ownsby
Bought by
Christie Ownsby Duke Gst Trust
Purchase Details
Closed on
Jul 7, 1998
Sold by
Ownsby J C and Ownsby Etta C
Bought by
Ownsby J C and Erwin Camille Ownsby
Create a Home Valuation Report for This Property
The Home Valuation Report is an in-depth analysis detailing your home's value as well as a comparison with similar homes in the area
Home Values in the Area
Average Home Value in this Area
Purchase History
| Date | Buyer | Sale Price | Title Company |
|---|---|---|---|
| Settle Living Trust | -- | None Listed On Document | |
| Settle Toby John | -- | None Available | |
| Christie Ownsby Duke Gst Trust | -- | None Available | |
| Ownsby J C | -- | -- |
Source: Public Records
Tax History Compared to Growth
Tax History
| Year | Tax Paid | Tax Assessment Tax Assessment Total Assessment is a certain percentage of the fair market value that is determined by local assessors to be the total taxable value of land and additions on the property. | Land | Improvement |
|---|---|---|---|---|
| 2025 | $10,851 | $647,990 | $252,000 | $395,990 |
| 2024 | $10,851 | $592,659 | $210,000 | $419,557 |
| 2023 | $9,812 | $538,781 | $168,000 | $512,874 |
| 2022 | $12,157 | $530,409 | $135,000 | $395,409 |
| 2021 | $10,398 | $445,274 | $117,000 | $328,274 |
| 2020 | $8,804 | $410,810 | $108,000 | $302,810 |
| 2019 | $8,061 | $316,483 | $108,000 | $215,437 |
| 2018 | $7,357 | $287,712 | $90,000 | $226,948 |
| 2017 | $6,688 | $266,924 | $81,000 | $185,924 |
| 2016 | $6,122 | $248,140 | $63,000 | $185,140 |
| 2015 | $2,498 | $216,162 | $63,000 | $153,162 |
Source: Public Records
Map
Nearby Homes