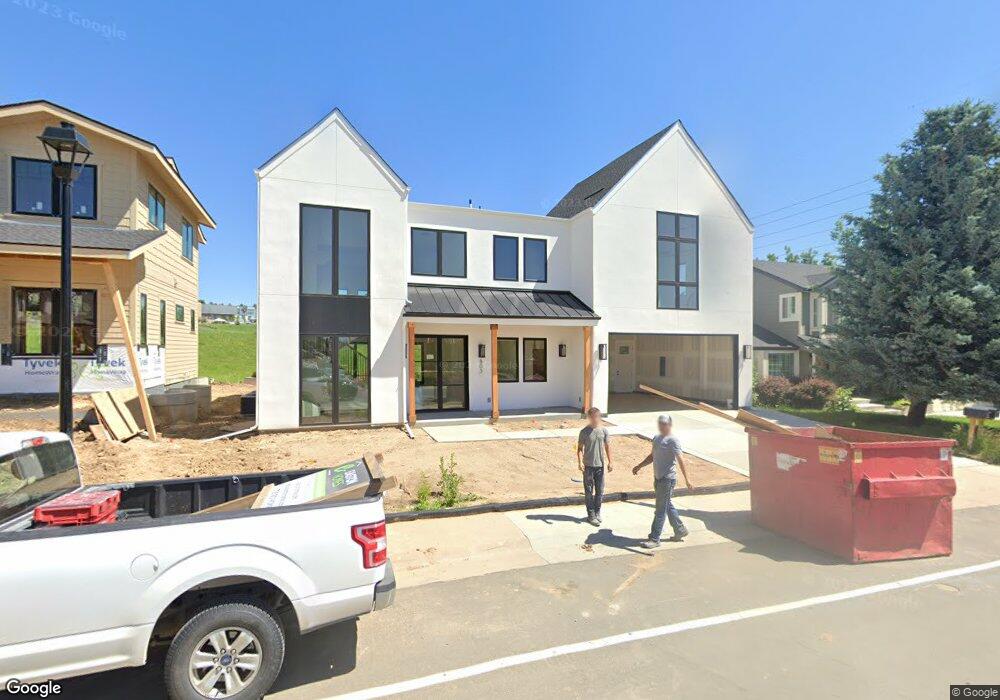
803 W Mulberry St Louisville, CO 80027
Estimated Value: $1,173,000 - $1,494,000
4
Beds
4
Baths
2,823
Sq Ft
$480/Sq Ft
Est. Value
About This Home
This home is located at 803 W Mulberry St, Louisville, CO 80027 and is currently estimated at $1,354,941, approximately $479 per square foot. 803 W Mulberry St is a home located in Boulder County with nearby schools including Fireside Elementary School, Monarch K-8 School, and Monarch High School.
Ownership History
Date
Name
Owned For
Owner Type
Purchase Details
Closed on
Dec 8, 2006
Sold by
Bendrick Marci A and Sannes Michael E
Bought by
Sannes Michael E
Current Estimated Value
Home Financials for this Owner
Home Financials are based on the most recent Mortgage that was taken out on this home.
Original Mortgage
$80,000
Outstanding Balance
$47,804
Interest Rate
6.3%
Mortgage Type
Credit Line Revolving
Estimated Equity
$1,307,137
Purchase Details
Closed on
Feb 28, 2002
Sold by
Stull Suzanne J
Bought by
Bendrick Marci A and Sannels Michael E
Home Financials for this Owner
Home Financials are based on the most recent Mortgage that was taken out on this home.
Original Mortgage
$296,800
Outstanding Balance
$121,798
Interest Rate
6.81%
Estimated Equity
$1,233,143
Purchase Details
Closed on
Dec 29, 1997
Sold by
Stull William B and Stull Suzanne J
Bought by
Stull Suzanne J
Home Financials for this Owner
Home Financials are based on the most recent Mortgage that was taken out on this home.
Original Mortgage
$170,000
Interest Rate
7.13%
Purchase Details
Closed on
Jul 27, 1992
Bought by
Sannes Marci A and Sannes Michael E
Purchase Details
Closed on
Oct 19, 1990
Bought by
Sannes Marci A and Sannes Michael E
Create a Home Valuation Report for This Property
The Home Valuation Report is an in-depth analysis detailing your home's value as well as a comparison with similar homes in the area
Home Values in the Area
Average Home Value in this Area
Purchase History
| Date | Buyer | Sale Price | Title Company |
|---|---|---|---|
| Sannes Michael E | -- | Land Title | |
| Bendrick Marci A | $371,000 | Land Title | |
| Stull Suzanne J | -- | Land Title | |
| Sannes Marci A | $169,000 | -- | |
| Sannes Marci A | $1,088,600 | -- | |
| Sannes Marci A | -- | -- |
Source: Public Records
Mortgage History
| Date | Status | Borrower | Loan Amount |
|---|---|---|---|
| Open | Sannes Michael E | $80,000 | |
| Open | Bendrick Marci A | $296,800 | |
| Previous Owner | Stull Suzanne J | $170,000 |
Source: Public Records
Tax History Compared to Growth
Tax History
| Year | Tax Paid | Tax Assessment Tax Assessment Total Assessment is a certain percentage of the fair market value that is determined by local assessors to be the total taxable value of land and additions on the property. | Land | Improvement |
|---|---|---|---|---|
| 2025 | $9,355 | $102,938 | $20,238 | $82,700 |
| 2024 | $9,355 | $102,938 | $20,238 | $82,700 |
| 2023 | $3,246 | $104,085 | $21,413 | $86,356 |
| 2022 | $813 | $8,448 | $8,448 | $0 |
| 2021 | $5,532 | $59,731 | $17,382 | $42,349 |
| 2020 | $4,960 | $53,003 | $14,014 | $38,989 |
| 2019 | $4,890 | $53,003 | $14,014 | $38,989 |
| 2018 | $4,383 | $49,061 | $9,432 | $39,629 |
| 2017 | $3,791 | $47,872 | $10,428 | $37,444 |
| 2016 | $3,602 | $40,939 | $11,224 | $29,715 |
| 2015 | $3,414 | $35,310 | $19,422 | $15,888 |
| 2014 | $3,019 | $35,310 | $19,422 | $15,888 |
Source: Public Records
Map
Nearby Homes
- 118 S Tanager Ct
- 812 W Mulberry St
- 494 Owl Dr Unit 4
- 408 Fillmore Ct
- 159 S Polk Ave
- 810 Trail Ridge Dr
- 641 W Dahlia St
- 900 Eldorado Ln
- 279 S Taft Ct Unit 53
- 823 Trail Ridge Dr
- 323 S Taft Ct Unit 26
- 848 Trail Ridge Dr
- 305 S Taft Ct Unit 33
- 284 S Taft Ct Unit 76
- 958 Eldorado Ln
- 592 Spruce Cir
- 362 S Taft Ct Unit 108
- 955 Arapahoe Cir
- 935 Eldorado Ln Unit A
- 935 Eldorado Ln
- 801 W Mulberry St
- 805 W Mulberry St
- 807 W Mulberry St
- 102 Vista Ln
- 802 W Mulberry St
- 809 W Mulberry St
- 104 Vista Ln
- 804 W Mulberry St
- 791 W Mulberry St
- 105 Vista Ln
- 811 W Mulberry St
- 752 W Hemlock Cir
- 107 S Tanager Ct
- 806 W Mulberry St
- 106 Vista Ln
- 750 W Hemlock Cir
- 777 W Mulberry St
- 111 S Tanager Ct
- 107 Vista Ln
- 813 W Mulberry St