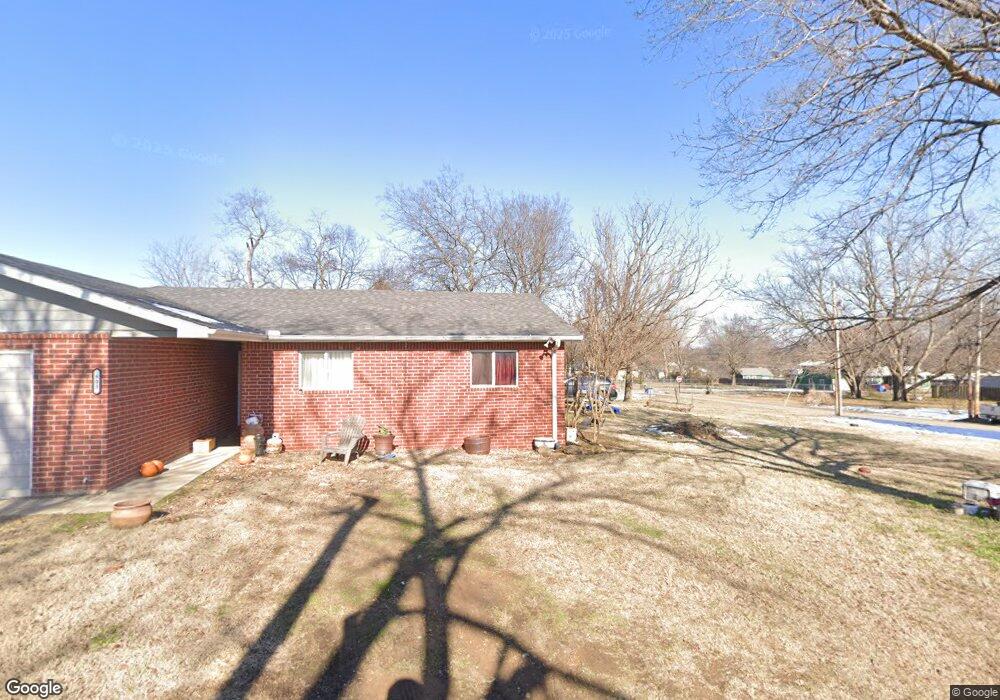
803 W Rankin Ave Checotah, OK 74426
Estimated Value: $219,697 - $257,000
3
Beds
2
Baths
1,920
Sq Ft
$123/Sq Ft
Est. Value
About This Home
This home is located at 803 W Rankin Ave, Checotah, OK 74426 and is currently estimated at $235,424, approximately $122 per square foot. 803 W Rankin Ave is a home with nearby schools including Marshall Elementary School, Checotah Intermediate Elementary School, and Checotah Middle School.
Ownership History
Date
Name
Owned For
Owner Type
Purchase Details
Closed on
Jan 6, 2017
Sold by
Marrel Callie Elizabeth and Hall Calle Elizabeth
Bought by
Fancher Angela Marie
Current Estimated Value
Home Financials for this Owner
Home Financials are based on the most recent Mortgage that was taken out on this home.
Original Mortgage
$116,060
Outstanding Balance
$95,535
Interest Rate
4.08%
Mortgage Type
New Conventional
Estimated Equity
$139,889
Purchase Details
Closed on
Nov 13, 2013
Sold by
Marrel Wesley and Marrel Callie
Bought by
Marrel Callie
Purchase Details
Closed on
Sep 14, 2012
Sold by
Hogan Bob G
Bought by
Marrel Wesley and Marrel Callie
Home Financials for this Owner
Home Financials are based on the most recent Mortgage that was taken out on this home.
Original Mortgage
$53,203
Interest Rate
3.59%
Mortgage Type
Future Advance Clause Open End Mortgage
Purchase Details
Closed on
Mar 10, 1994
Purchase Details
Closed on
May 22, 1991
Create a Home Valuation Report for This Property
The Home Valuation Report is an in-depth analysis detailing your home's value as well as a comparison with similar homes in the area
Home Values in the Area
Average Home Value in this Area
Purchase History
| Date | Buyer | Sale Price | Title Company |
|---|---|---|---|
| Fancher Angela Marie | $115,000 | Nations Title Of Okc | |
| Marrel Callie | -- | -- | |
| Marrel Wesley | $93,000 | None Available | |
| -- | $22,500 | -- | |
| -- | $22,500 | -- |
Source: Public Records
Mortgage History
| Date | Status | Borrower | Loan Amount |
|---|---|---|---|
| Open | Fancher Angela Marie | $116,060 | |
| Previous Owner | Marrel Wesley | $53,203 |
Source: Public Records
Tax History Compared to Growth
Tax History
| Year | Tax Paid | Tax Assessment Tax Assessment Total Assessment is a certain percentage of the fair market value that is determined by local assessors to be the total taxable value of land and additions on the property. | Land | Improvement |
|---|---|---|---|---|
| 2024 | $1,154 | $14,831 | $785 | $14,046 |
| 2023 | $1,154 | $13,980 | $747 | $13,233 |
| 2022 | $1,083 | $13,573 | $724 | $12,849 |
| 2021 | $1,155 | $13,573 | $724 | $12,849 |
| 2020 | $1,134 | $12,793 | $1,013 | $11,780 |
| 2019 | $1,126 | $12,793 | $1,013 | $11,780 |
| 2018 | $1,119 | $12,794 | $1,013 | $11,781 |
| 2017 | $1,121 | $11,902 | $1,013 | $10,889 |
| 2016 | $1,093 | $11,336 | $1,013 | $10,323 |
| 2015 | $1,080 | $11,189 | $1,013 | $10,176 |
| 2014 | $1,128 | $11,721 | $1,013 | $10,708 |
Source: Public Records
Map
Nearby Homes
- 705 NW 8th St
- 112580 New Texanna Rd
- 737 NW 4th St
- 0 S 4202 Rd Unit 2518287
- 410 SW 3rd St
- 0 W North Ave
- 513 N Wineblood St
- 605 N Wineblood St
- 613 N Wineblood St
- 504 SW 1st St
- 825 NW 8th St
- 0 SE Main St
- 424398 Texanna Rd
- 220 E Audd Ave
- 508 Kimberly Dr
- 514 SE Main St
- 0 Lakeland St Unit 2436639
- 310 E Audd Ave
- 1045 W Mcintosh Ave
- 0 Paul Carr Dr Unit 2524865
- 220 NW 5th St
- 226 NW 5th St
- 223 NW 6th St
- 1400 W Gentry Ave
- 214 NW 5th St
- 213 NW 6th St
- 302 NW 5th St
- 211 NW 6th St
- 308 NW 5th St
- 712 W Okmulgee Ave
- 213 NW 5th St
- 216 NW 6th St
- 208 NW 5th St
- 228 NW 6th St
- 211 NW 5th St
- 811 W Spaulding St
- 307 NW 6th St
- 212 NW 6th St
- 807 W Spaulding St
- 713 W Okmulgee Ave