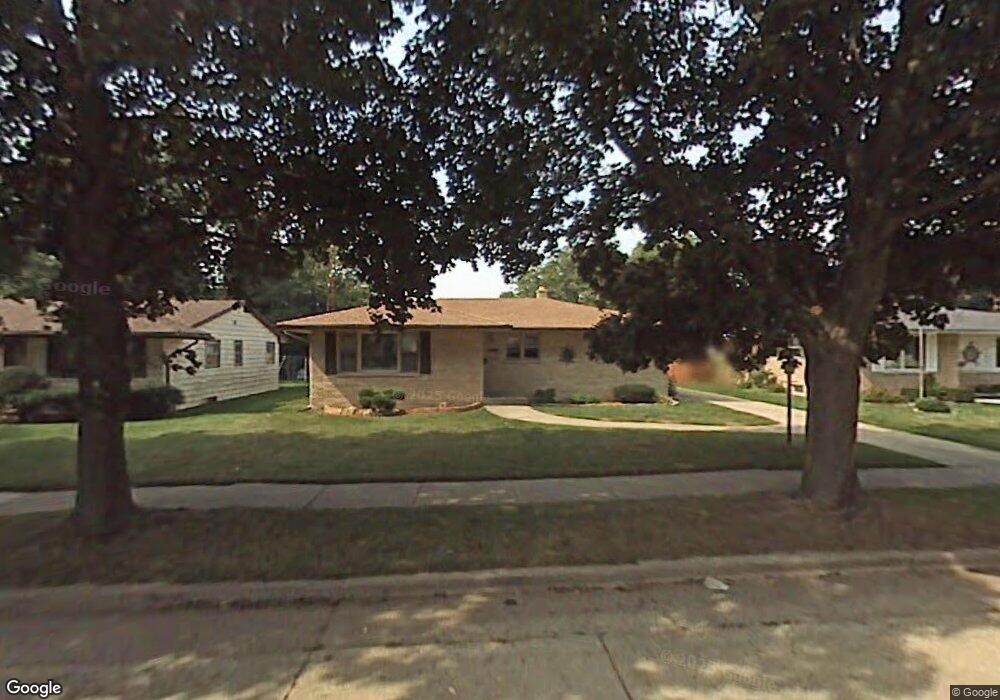
8030 17th Ave Kenosha, WI 53143
Sunnyside NeighborhoodEstimated Value: $257,365 - $306,000
3
Beds
1
Bath
1,210
Sq Ft
$231/Sq Ft
Est. Value
About This Home
This home is located at 8030 17th Ave, Kenosha, WI 53143 and is currently estimated at $280,091, approximately $231 per square foot. 8030 17th Ave is a home located in Kenosha County with nearby schools including Vernon Elementary School, Lincoln Middle School, and Tremper High School.
Ownership History
Date
Name
Owned For
Owner Type
Purchase Details
Closed on
Dec 21, 2017
Sold by
William & Fong Llc
Bought by
Happy Family Llc
Current Estimated Value
Purchase Details
Closed on
Jan 25, 2016
Sold by
Yee William
Bought by
William & Fong Llc
Purchase Details
Closed on
Mar 28, 2014
Sold by
Yee William
Bought by
Yee William and Yee Fong W
Purchase Details
Closed on
Jun 12, 2013
Sold by
Pfeiffer Brandon
Bought by
Federal Home Loan Mortgage Corporation
Purchase Details
Closed on
May 18, 2007
Sold by
Yance Gregory A
Bought by
Pfeiffer Brandon Amd Nicole
Create a Home Valuation Report for This Property
The Home Valuation Report is an in-depth analysis detailing your home's value as well as a comparison with similar homes in the area
Home Values in the Area
Average Home Value in this Area
Purchase History
| Date | Buyer | Sale Price | Title Company |
|---|---|---|---|
| Happy Family Llc | $129,800 | -- | |
| William & Fong Llc | $128,000 | -- | |
| Yee William | $75,000 | -- | |
| Federal Home Loan Mortgage Corporation | $116,500 | -- | |
| Pfeiffer Brandon Amd Nicole | $162,000 | -- |
Source: Public Records
Mortgage History
| Date | Status | Borrower | Loan Amount |
|---|---|---|---|
| Closed | Federal Home Loan Mortgage Corporation | $0 |
Source: Public Records
Tax History
| Year | Tax Paid | Tax Assessment Tax Assessment Total Assessment is a certain percentage of the fair market value that is determined by local assessors to be the total taxable value of land and additions on the property. | Land | Improvement |
|---|---|---|---|---|
| 2025 | $3,661 | $218,000 | $52,800 | $165,200 |
| 2024 | $3,609 | $147,200 | $35,700 | $111,500 |
| 2023 | $3,609 | $147,200 | $35,700 | $111,500 |
| 2022 | $3,643 | $147,200 | $35,700 | $111,500 |
| 2021 | $3,768 | $147,200 | $35,700 | $111,500 |
| 2020 | $3,838 | $147,200 | $35,700 | $111,500 |
| 2019 | $3,709 | $147,200 | $35,700 | $111,500 |
| 2018 | $3,642 | $129,800 | $35,700 | $94,100 |
| 2017 | $3,513 | $129,800 | $35,700 | $94,100 |
| 2016 | $3,442 | $129,800 | $35,700 | $94,100 |
| 2015 | $3,530 | $128,300 | $35,700 | $92,600 |
| 2014 | $3,514 | $128,300 | $35,700 | $92,600 |
Source: Public Records
Map
Nearby Homes
- 0 Confidential - Unit 1932390
- 7921 18th Ave
- 8204 15th Ave
- 1902 84th St
- 7923 Sheridan Rd
- 8421 17th Ave
- 8415 14th Ave
- 7721 14th Ave
- 1703 84th Place
- 807 82nd St Unit 14
- 7616 15th Ave
- 2008 85th St
- 807 79th St
- 7822 8th Ave
- 7547 22nd Ave
- 2304 85th St
- 2575 Lincoln Rd
- 8521 Sheridan Rd
- 7511 22nd Ave
- 1901 74th Place
Your Personal Tour Guide
Ask me questions while you tour the home.