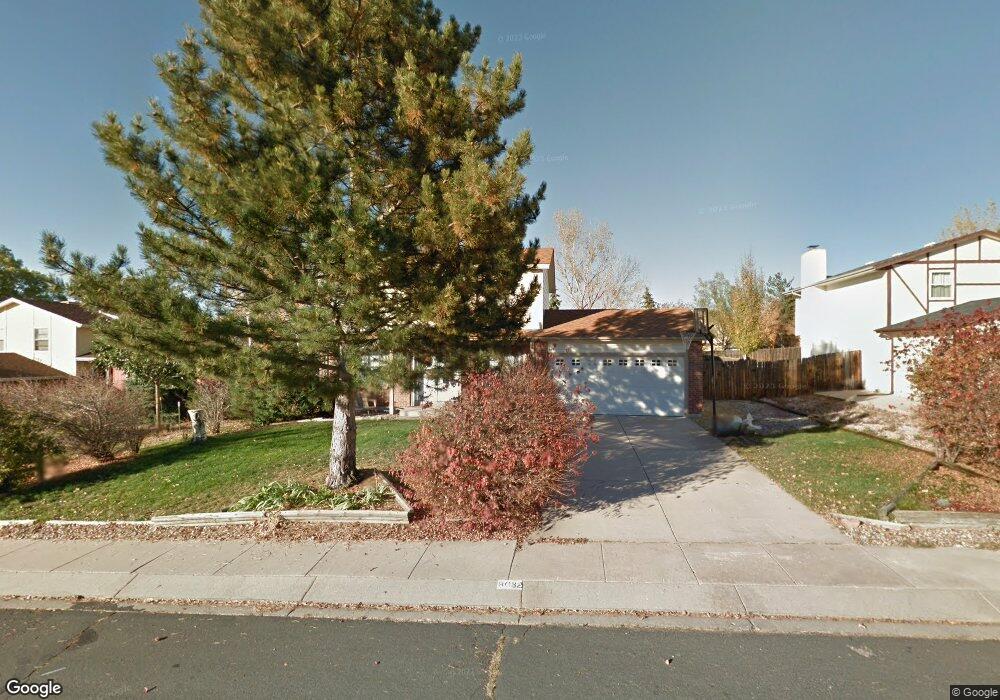
8032 Horizon Dr Colorado Springs, CO 80920
Briargate NeighborhoodEstimated Value: $439,839 - $485,000
3
Beds
3
Baths
1,463
Sq Ft
$315/Sq Ft
Est. Value
About This Home
This home is located at 8032 Horizon Dr, Colorado Springs, CO 80920 and is currently estimated at $460,710, approximately $314 per square foot. 8032 Horizon Dr is a home located in El Paso County with nearby schools including High Plains Elementary School, Mountain Ridge Middle School, and Rampart High School.
Ownership History
Date
Name
Owned For
Owner Type
Purchase Details
Closed on
Aug 28, 2009
Sold by
Ucker Cindy L
Bought by
Martins Diahn
Current Estimated Value
Home Financials for this Owner
Home Financials are based on the most recent Mortgage that was taken out on this home.
Original Mortgage
$200,305
Outstanding Balance
$130,799
Interest Rate
5.16%
Mortgage Type
FHA
Estimated Equity
$329,911
Purchase Details
Closed on
Mar 27, 2006
Sold by
Ucker David C
Bought by
Ucker Cindy L
Purchase Details
Closed on
Jun 10, 2002
Sold by
Allen Robinson Patricia L
Bought by
Ucker David C
Home Financials for this Owner
Home Financials are based on the most recent Mortgage that was taken out on this home.
Original Mortgage
$169,265
Interest Rate
6.77%
Purchase Details
Closed on
Jul 1, 1988
Bought by
Martins Diahn
Purchase Details
Closed on
Feb 1, 1985
Bought by
Martins Diahn
Purchase Details
Closed on
Nov 1, 1982
Bought by
Martins Diahn
Create a Home Valuation Report for This Property
The Home Valuation Report is an in-depth analysis detailing your home's value as well as a comparison with similar homes in the area
Home Values in the Area
Average Home Value in this Area
Purchase History
| Date | Buyer | Sale Price | Title Company |
|---|---|---|---|
| Martins Diahn | $204,000 | Land Title Guarantee Company | |
| Ucker Cindy L | -- | None Available | |
| Ucker David C | $174,500 | Land Title | |
| Martins Diahn | -- | -- | |
| Martins Diahn | -- | -- | |
| Martins Diahn | -- | -- |
Source: Public Records
Mortgage History
| Date | Status | Borrower | Loan Amount |
|---|---|---|---|
| Open | Martins Diahn | $200,305 | |
| Previous Owner | Ucker David C | $169,265 |
Source: Public Records
Tax History Compared to Growth
Tax History
| Year | Tax Paid | Tax Assessment Tax Assessment Total Assessment is a certain percentage of the fair market value that is determined by local assessors to be the total taxable value of land and additions on the property. | Land | Improvement |
|---|---|---|---|---|
| 2025 | $1,917 | $32,340 | -- | -- |
| 2024 | $1,874 | $33,660 | $5,360 | $28,300 |
| 2022 | $1,636 | $23,180 | $4,340 | $18,840 |
| 2021 | $1,704 | $23,840 | $4,460 | $19,380 |
| 2020 | $1,638 | $21,280 | $3,720 | $17,560 |
| 2019 | $1,621 | $21,280 | $3,720 | $17,560 |
| 2018 | $1,284 | $16,560 | $2,880 | $13,680 |
| 2017 | $1,279 | $16,560 | $2,880 | $13,680 |
| 2016 | $1,262 | $16,320 | $2,930 | $13,390 |
| 2015 | $1,259 | $16,320 | $2,930 | $13,390 |
| 2014 | $1,178 | $15,250 | $2,930 | $12,320 |
Source: Public Records
Map
Nearby Homes
- 8146 Horizon Dr
- 2615 Thrush Grove
- 2512 Elite Terrace
- 2650 Bannister Ct
- 7849 Flicker Grove
- 2768 Thrush Grove
- 7420 Lomas Ct
- 7530 Madrid Ct
- 7404 Casa Grande Ct
- 2110 Whitehorn Dr N
- 3326 Soaring Bird Cir
- 3142 Soaring Bird Cir
- 1932 Silkwood Dr
- 8184 Brigantine Dr
- 3339 Union Jack Way
- 7424 Bell Dr
- 8161 Regiment Ct
- 3315 Mexico Ct
- 2068 Silkwood Dr
- 2270 Cloverdale Dr
- 8026 Horizon Dr
- 8038 Horizon Dr
- 2655 Zephyr Dr
- 2661 Zephyr Dr
- 2649 Zephyr Dr
- 8020 Horizon Dr
- 8044 Horizon Dr
- 8029 Horizon Dr
- 2643 Zephyr Dr
- 2667 Zephyr Dr
- 8041 Horizon Dr
- 8023 Horizon Dr
- 8014 Horizon Dr
- 8050 Horizon Dr
- 2673 Zephyr Dr
- 2637 Zephyr Dr
- 8017 Horizon Dr
- 2613 Legend Dr
- 2612 Legend Dr
- 2656 Zephyr Dr