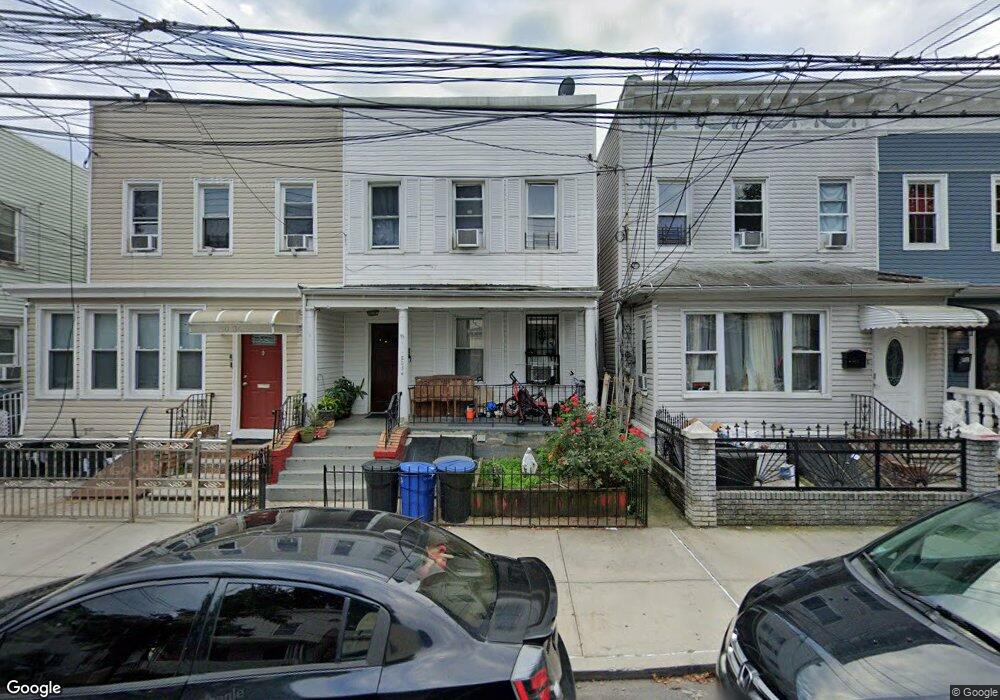
8034 89th Ave Woodhaven, NY 11421
Woodhaven NeighborhoodEstimated Value: $826,358 - $971,000
--
Bed
--
Bath
1,992
Sq Ft
$450/Sq Ft
Est. Value
About This Home
This home is located at 8034 89th Ave, Woodhaven, NY 11421 and is currently estimated at $895,590, approximately $449 per square foot. 8034 89th Ave is a home located in Queens County with nearby schools including P.S. 060 Woodhaven, Santiam Elementary School, and Alice Ott Middle School.
Ownership History
Date
Name
Owned For
Owner Type
Purchase Details
Closed on
Oct 18, 2013
Sold by
Chandan Vickram and Nepal Yadram
Bought by
Del Rocio Dominguez Condo Hermelinda and Maria Lema
Current Estimated Value
Home Financials for this Owner
Home Financials are based on the most recent Mortgage that was taken out on this home.
Original Mortgage
$365,000
Outstanding Balance
$273,269
Interest Rate
4.56%
Mortgage Type
New Conventional
Estimated Equity
$622,321
Create a Home Valuation Report for This Property
The Home Valuation Report is an in-depth analysis detailing your home's value as well as a comparison with similar homes in the area
Home Values in the Area
Average Home Value in this Area
Purchase History
| Date | Buyer | Sale Price | Title Company |
|---|---|---|---|
| Del Rocio Dominguez Condo Hermelinda | $375,000 | -- | |
| Del Rocio Dominguez Condo Hermelinda | $375,000 | -- |
Source: Public Records
Mortgage History
| Date | Status | Borrower | Loan Amount |
|---|---|---|---|
| Open | Del Rocio Dominguez Condo Hermelinda | $365,000 | |
| Closed | Del Rocio Dominguez Condo Hermelinda | $365,000 |
Source: Public Records
Tax History Compared to Growth
Tax History
| Year | Tax Paid | Tax Assessment Tax Assessment Total Assessment is a certain percentage of the fair market value that is determined by local assessors to be the total taxable value of land and additions on the property. | Land | Improvement |
|---|---|---|---|---|
| 2025 | $5,504 | $30,526 | $8,766 | $21,760 |
| 2024 | $5,516 | $28,805 | $9,915 | $18,890 |
| 2023 | $5,504 | $28,805 | $8,942 | $19,863 |
| 2022 | $5,206 | $40,740 | $15,180 | $25,560 |
| 2021 | $5,374 | $40,680 | $15,180 | $25,500 |
| 2020 | $5,088 | $44,280 | $15,180 | $29,100 |
| 2019 | $4,729 | $41,280 | $15,180 | $26,100 |
| 2018 | $4,596 | $24,004 | $8,713 | $15,291 |
| 2017 | $4,374 | $22,929 | $10,471 | $12,458 |
| 2016 | $4,178 | $22,929 | $10,471 | $12,458 |
| 2015 | $2,389 | $21,198 | $13,091 | $8,107 |
| 2014 | $2,389 | $20,004 | $13,448 | $6,556 |
Source: Public Records
Map
Nearby Homes