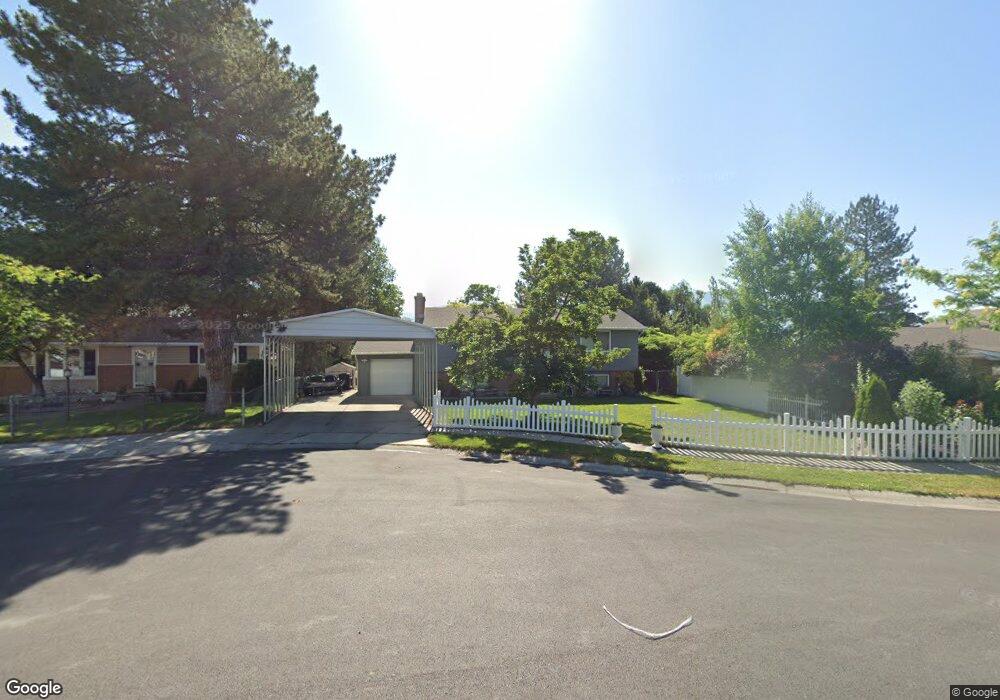
8037 Laguna Cir West Jordan, UT 84088
Estimated Value: $505,000 - $574,000
4
Beds
3
Baths
2,016
Sq Ft
$267/Sq Ft
Est. Value
About This Home
This home is located at 8037 Laguna Cir, West Jordan, UT 84088 and is currently estimated at $538,454, approximately $267 per square foot. 8037 Laguna Cir is a home located in Salt Lake County with nearby schools including Westvale Elementary School, West Jordan Middle School, and West Jordan High School.
Ownership History
Date
Name
Owned For
Owner Type
Purchase Details
Closed on
Aug 26, 2020
Sold by
Faull Jeremy L
Bought by
Faull Jeremy
Current Estimated Value
Home Financials for this Owner
Home Financials are based on the most recent Mortgage that was taken out on this home.
Original Mortgage
$230,700
Outstanding Balance
$164,631
Interest Rate
2.9%
Mortgage Type
New Conventional
Estimated Equity
$373,823
Purchase Details
Closed on
May 15, 2015
Sold by
Brighter Tomorrow Investment Properties
Bought by
Faull Jeremy L
Home Financials for this Owner
Home Financials are based on the most recent Mortgage that was taken out on this home.
Original Mortgage
$241,544
Interest Rate
4.5%
Mortgage Type
FHA
Purchase Details
Closed on
Jan 15, 2015
Sold by
33 Holdings Llc
Bought by
Brighter Tomorrow Investment Properties
Purchase Details
Closed on
Jan 14, 2015
Sold by
Gomez Elizabeth
Bought by
33 Holdings Llc
Purchase Details
Closed on
Jan 11, 2011
Sold by
Perdomo Catalina
Bought by
Nieto Roman Amador Urbieta
Purchase Details
Closed on
Jul 25, 2007
Sold by
Gomez Elizabeth
Bought by
Perdomo Catalina
Purchase Details
Closed on
Dec 30, 2005
Sold by
Segura Maria Virtudes
Bought by
Gomez Elizabeth
Home Financials for this Owner
Home Financials are based on the most recent Mortgage that was taken out on this home.
Original Mortgage
$124,000
Interest Rate
8.05%
Mortgage Type
Purchase Money Mortgage
Purchase Details
Closed on
Mar 3, 2005
Sold by
Contreras Manuel Ricardo
Bought by
Segura Maria Virtudes
Purchase Details
Closed on
Apr 11, 2001
Sold by
Hud
Bought by
Zitting Clarence
Home Financials for this Owner
Home Financials are based on the most recent Mortgage that was taken out on this home.
Original Mortgage
$114,187
Interest Rate
7.09%
Mortgage Type
FHA
Purchase Details
Closed on
Jan 10, 2001
Sold by
Chase Manhattan Mtg Corp
Bought by
Hud
Purchase Details
Closed on
Dec 14, 2000
Sold by
Losee Steven C
Bought by
Chase Manhattan Mtg Corp
Purchase Details
Closed on
Nov 22, 1999
Sold by
Dailami Julie
Bought by
Losee Steven C
Home Financials for this Owner
Home Financials are based on the most recent Mortgage that was taken out on this home.
Original Mortgage
$124,969
Interest Rate
7.84%
Mortgage Type
FHA
Create a Home Valuation Report for This Property
The Home Valuation Report is an in-depth analysis detailing your home's value as well as a comparison with similar homes in the area
Home Values in the Area
Average Home Value in this Area
Purchase History
| Date | Buyer | Sale Price | Title Company |
|---|---|---|---|
| Faull Jeremy | -- | Capstone Title & Escrow | |
| Faull Jeremy L | -- | Greenbrier Title Ins Agcy In | |
| Brighter Tomorrow Investment Properties | -- | Accommodation | |
| 33 Holdings Llc | $147,500 | None Available | |
| Nieto Roman Amador Urbieta | -- | None Available | |
| Perdomo Catalina | -- | Preferred Title & Escrow Ins | |
| Gomez Elizabeth | -- | Preferred Title & Escrow Ins | |
| Segura Maria Virtudes | -- | -- | |
| Zitting Clarence | -- | First American Title | |
| Hud | -- | Backman Stewart Title Servic | |
| Chase Manhattan Mtg Corp | $141,281 | Backman Stewart Title Servic | |
| Losee Steven C | -- | First American Title Ins Co |
Source: Public Records
Mortgage History
| Date | Status | Borrower | Loan Amount |
|---|---|---|---|
| Open | Faull Jeremy | $230,700 | |
| Closed | Faull Jeremy L | $241,544 | |
| Previous Owner | Gomez Elizabeth | $124,000 | |
| Previous Owner | Gomez Elizabeth | $31,000 | |
| Previous Owner | Zitting Clarence | $114,187 | |
| Previous Owner | Losee Steven C | $124,969 |
Source: Public Records
Tax History Compared to Growth
Tax History
| Year | Tax Paid | Tax Assessment Tax Assessment Total Assessment is a certain percentage of the fair market value that is determined by local assessors to be the total taxable value of land and additions on the property. | Land | Improvement |
|---|---|---|---|---|
| 2025 | $2,420 | $484,200 | $140,200 | $344,000 |
| 2024 | $2,420 | $465,600 | $135,200 | $330,400 |
| 2023 | $2,370 | $429,800 | $128,800 | $301,000 |
| 2022 | $2,459 | $438,600 | $126,300 | $312,300 |
| 2021 | $2,073 | $336,600 | $103,000 | $233,600 |
| 2020 | $1,959 | $298,600 | $103,000 | $195,600 |
| 2019 | $1,965 | $293,600 | $103,000 | $190,600 |
| 2018 | $1,770 | $262,300 | $77,800 | $184,500 |
| 2017 | $1,655 | $244,200 | $77,800 | $166,400 |
| 2016 | $1,592 | $220,800 | $77,800 | $143,000 |
| 2015 | $1,376 | $186,000 | $88,900 | $97,100 |
| 2014 | $1,317 | $175,300 | $84,600 | $90,700 |
Source: Public Records
Map
Nearby Homes
- 8026 Laguna Cir
- 2497 Bueno Vista Dr
- 8140 S 2245 W
- 14 San Miguel St
- 48 San Rafael Ct
- 7968 S 2700 W
- 7993 S 2760 W
- 2386 W 7680 S
- 8383 S 2200 W
- 77 Rio Bravo Place
- 2062 W 7705 S
- 7942 S 2800 W
- 7647 S 2500 W
- 8461 S 2385 W
- 1790 W Sugar Factory Rd
- 2169 W 7600 S
- 7645 S 1960 W
- 7987 S 2980 W
- 1829 W 7600 S Unit G301
- 1829 W 7600 S Unit G303
- 8027 Laguna Dr
- 8049 Laguna Cir
- 8049 S Laguna Cir
- 7330 Laguna Cir
- 8022 Laguna Dr
- 8059 Laguna Cir
- 8025 Laguna Cir
- 8025 S Laguna Cir
- 8048 Laguna Dr
- 8008 Laguna Dr
- 8008 S Laguna Dr
- 8036 Laguna Cir
- 8048 Laguna Cir
- 8048 S Laguna Cir
- 8024 Laguna Cir
- 8024 S Laguna Cir
- 2366 Bueno Vista Dr
- 7994 Laguna Dr
- 8058 Laguna Cir
- 2409 Laguna Dr