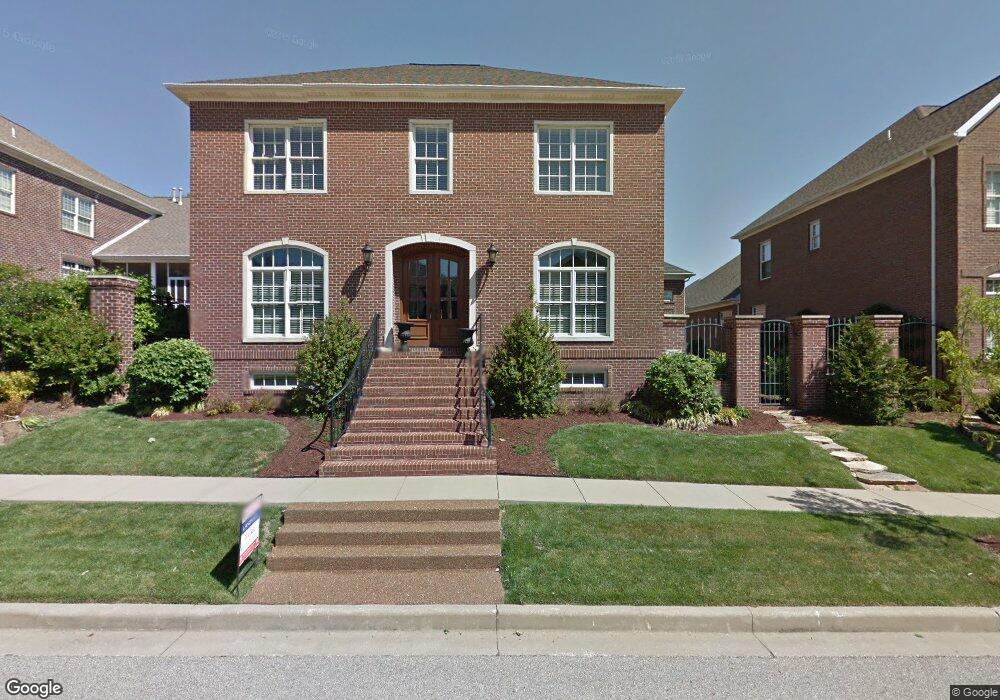
8037 Wyngate Cir Newburgh, IN 47630
Estimated Value: $637,000 - $743,000
4
Beds
4
Baths
4,809
Sq Ft
$145/Sq Ft
Est. Value
About This Home
This home is located at 8037 Wyngate Cir, Newburgh, IN 47630 and is currently estimated at $697,081, approximately $144 per square foot. 8037 Wyngate Cir is a home located in Warrick County with nearby schools including Sharon Elementary School, Castle South Middle School, and Castle High School.
Ownership History
Date
Name
Owned For
Owner Type
Purchase Details
Closed on
Jun 12, 2013
Sold by
Mans Charles C and Mans Kimberly C
Bought by
Kennedy G William and The G William Kennedy Revocabl
Current Estimated Value
Purchase Details
Closed on
Jun 8, 2007
Sold by
Miller Aaron M and Miller Kathryn M
Bought by
Mans Cahrles C and Mans Kimberly C
Home Financials for this Owner
Home Financials are based on the most recent Mortgage that was taken out on this home.
Original Mortgage
$463,200
Interest Rate
6.2%
Mortgage Type
New Conventional
Purchase Details
Closed on
May 1, 2005
Sold by
Barrington Development Group Inc
Bought by
Miller Aaron M and Miller Kathryn M
Create a Home Valuation Report for This Property
The Home Valuation Report is an in-depth analysis detailing your home's value as well as a comparison with similar homes in the area
Home Values in the Area
Average Home Value in this Area
Purchase History
| Date | Buyer | Sale Price | Title Company |
|---|---|---|---|
| Kennedy G William | -- | Lockyear Title Llc | |
| Mans Cahrles C | -- | None Available | |
| Miller Aaron M | -- | None Available |
Source: Public Records
Mortgage History
| Date | Status | Borrower | Loan Amount |
|---|---|---|---|
| Previous Owner | Mans Cahrles C | $463,200 |
Source: Public Records
Tax History Compared to Growth
Tax History
| Year | Tax Paid | Tax Assessment Tax Assessment Total Assessment is a certain percentage of the fair market value that is determined by local assessors to be the total taxable value of land and additions on the property. | Land | Improvement |
|---|---|---|---|---|
| 2024 | $5,305 | $636,900 | $65,800 | $571,100 |
| 2023 | $5,108 | $620,200 | $65,800 | $554,400 |
| 2022 | $5,178 | $591,000 | $47,300 | $543,700 |
| 2021 | $4,377 | $472,800 | $37,800 | $435,000 |
| 2020 | $4,196 | $437,800 | $34,600 | $403,200 |
| 2019 | $4,292 | $442,400 | $34,600 | $407,800 |
| 2018 | $4,082 | $434,500 | $34,600 | $399,900 |
| 2017 | $3,921 | $421,200 | $34,600 | $386,600 |
| 2016 | $3,905 | $421,900 | $34,600 | $387,300 |
| 2014 | $3,927 | $441,600 | $38,400 | $403,200 |
| 2013 | $3,873 | $449,800 | $38,400 | $411,400 |
Source: Public Records
Map
Nearby Homes
- 0 Willow Pond Rd
- 5599 Victoria Ct
- 8634 Briarose Ct
- 5455 E Timberwood Dr
- 7711 Woodland Dr
- 5610 Saint Catherine Ct
- 7844 Meadow Ln
- 7811 Ridgemont Dr
- 1060 Jefferson Ct
- 7766 Meadow Ln
- 7555 Upper Meadow Rd
- 7688 Meadow Ln
- 700 Coppers Edge Dr
- 1 Hillside Trail
- 7455 Oak Park Dr
- 519 Monroe St
- 8633 Outer Lincoln Ave
- 405 Middle St
- 8855 Framewood Dr
- 7366 Oakdale Dr
- 8027 Wyngate Cir
- 8051 Wyngate Cir
- 8185 Wyngate Cir
- 8021 Wyngate Cir
- 8171 Wyngate Cir
- 8040 Wyngate Cir
- 8034 Wyngate Cir
- 8046 Wyngate Cir
- 8024 Wyngate Cir
- 8198 Wyngate Cir
- 8018 Wyngate Cir
- 8060 Wyngate Cir
- 8122 Marywood Dr
- 8186 Wyngate Cir
- 8012 Wyngate Cir
- 8065 Wyngate Cir
- 8210 Wyngate Cir
- 8192 Wyngate Cir
- 8204 Wyngate Cir
- 8180 Wyngate Cir