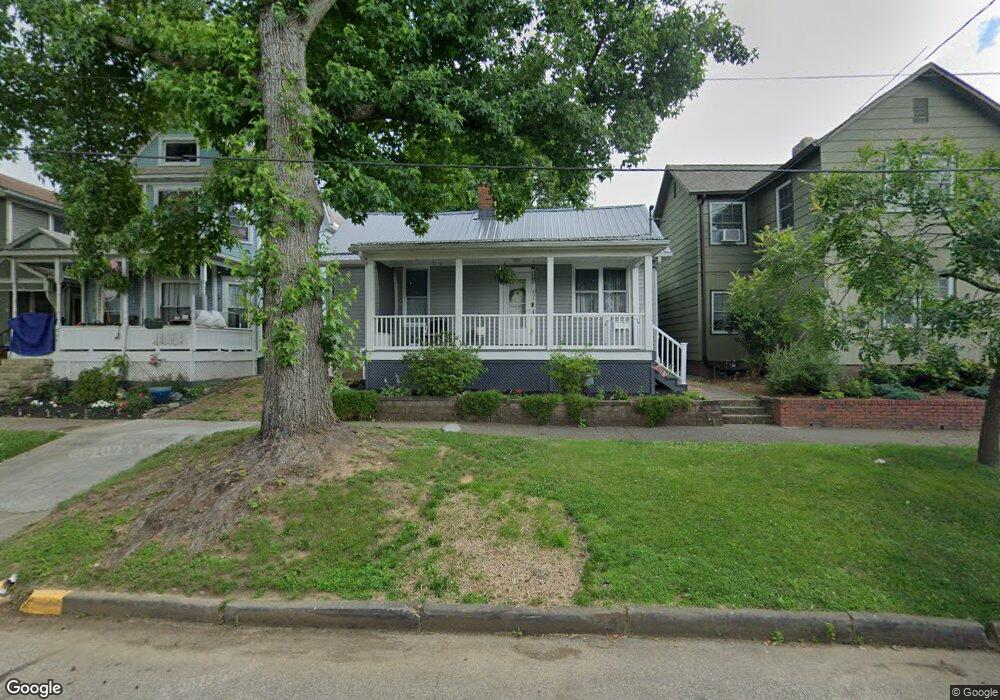
804 4th St Marietta, OH 45750
Estimated Value: $126,539 - $161,000
3
Beds
1
Bath
1,172
Sq Ft
$127/Sq Ft
Est. Value
About This Home
This home is located at 804 4th St, Marietta, OH 45750 and is currently estimated at $148,635, approximately $126 per square foot. 804 4th St is a home located in Washington County with nearby schools including Marietta High School, St. Mary Catholic School, and Veritas Classical Academy.
Ownership History
Date
Name
Owned For
Owner Type
Purchase Details
Closed on
Dec 21, 2007
Sold by
Mcguinness Stephanie G and Brooker Kevin
Bought by
Roach Marcia L
Current Estimated Value
Home Financials for this Owner
Home Financials are based on the most recent Mortgage that was taken out on this home.
Original Mortgage
$79,068
Outstanding Balance
$49,846
Interest Rate
6.31%
Mortgage Type
Purchase Money Mortgage
Estimated Equity
$98,789
Purchase Details
Closed on
Sep 25, 1998
Bought by
Mcguinness Stephanie G
Create a Home Valuation Report for This Property
The Home Valuation Report is an in-depth analysis detailing your home's value as well as a comparison with similar homes in the area
Home Values in the Area
Average Home Value in this Area
Purchase History
| Date | Buyer | Sale Price | Title Company |
|---|---|---|---|
| Roach Marcia L | $82,900 | Title First Marietta | |
| Mcguinness Stephanie G | $53,400 | -- | |
| Mcguinness Stephanie G | $53,400 | -- |
Source: Public Records
Mortgage History
| Date | Status | Borrower | Loan Amount |
|---|---|---|---|
| Open | Roach Marcia L | $79,068 |
Source: Public Records
Tax History
| Year | Tax Paid | Tax Assessment Tax Assessment Total Assessment is a certain percentage of the fair market value that is determined by local assessors to be the total taxable value of land and additions on the property. | Land | Improvement |
|---|---|---|---|---|
| 2024 | $1,154 | $32,960 | $2,300 | $30,660 |
| 2023 | $1,119 | $32,960 | $2,300 | $30,660 |
| 2022 | $1,112 | $32,960 | $2,300 | $30,660 |
| 2021 | $1,048 | $29,450 | $2,300 | $27,150 |
| 2020 | $1,047 | $29,450 | $2,300 | $27,150 |
| 2019 | $1,051 | $29,450 | $2,300 | $27,150 |
| 2018 | $993 | $27,030 | $2,000 | $25,030 |
| 2017 | $991 | $27,030 | $2,000 | $25,030 |
| 2016 | $1,735 | $27,030 | $2,000 | $25,030 |
| 2015 | $938 | $24,450 | $2,270 | $22,180 |
| 2014 | $1,571 | $24,450 | $2,270 | $22,180 |
| 2013 | $467 | $24,450 | $2,270 | $22,180 |
Source: Public Records
Map
Nearby Homes
Your Personal Tour Guide
Ask me questions while you tour the home.